Visualizing summary data with ResInsight
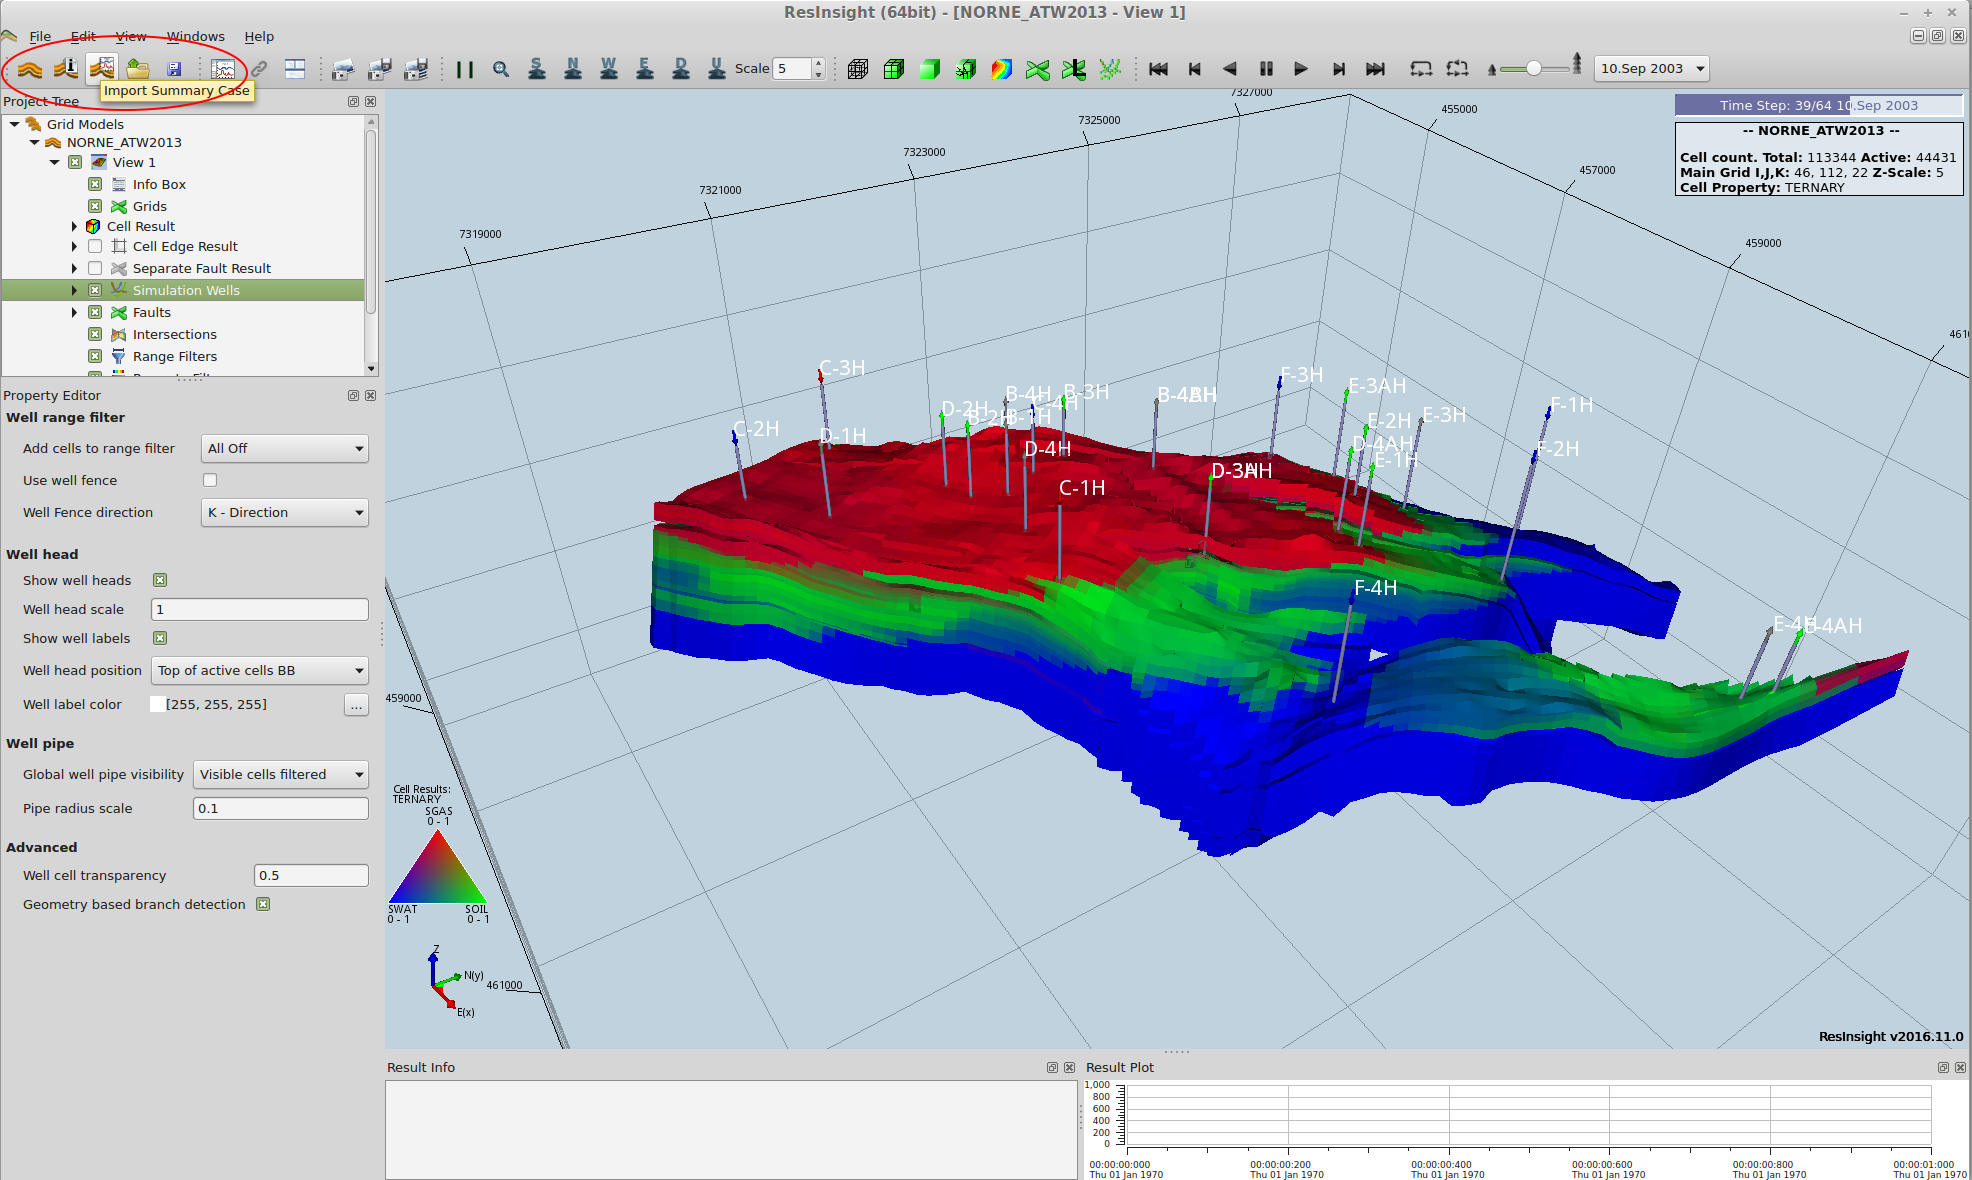
The ResInsight visualization tool can also display well curves and other summary data interactively. To do this, click the Import Summary Case button.
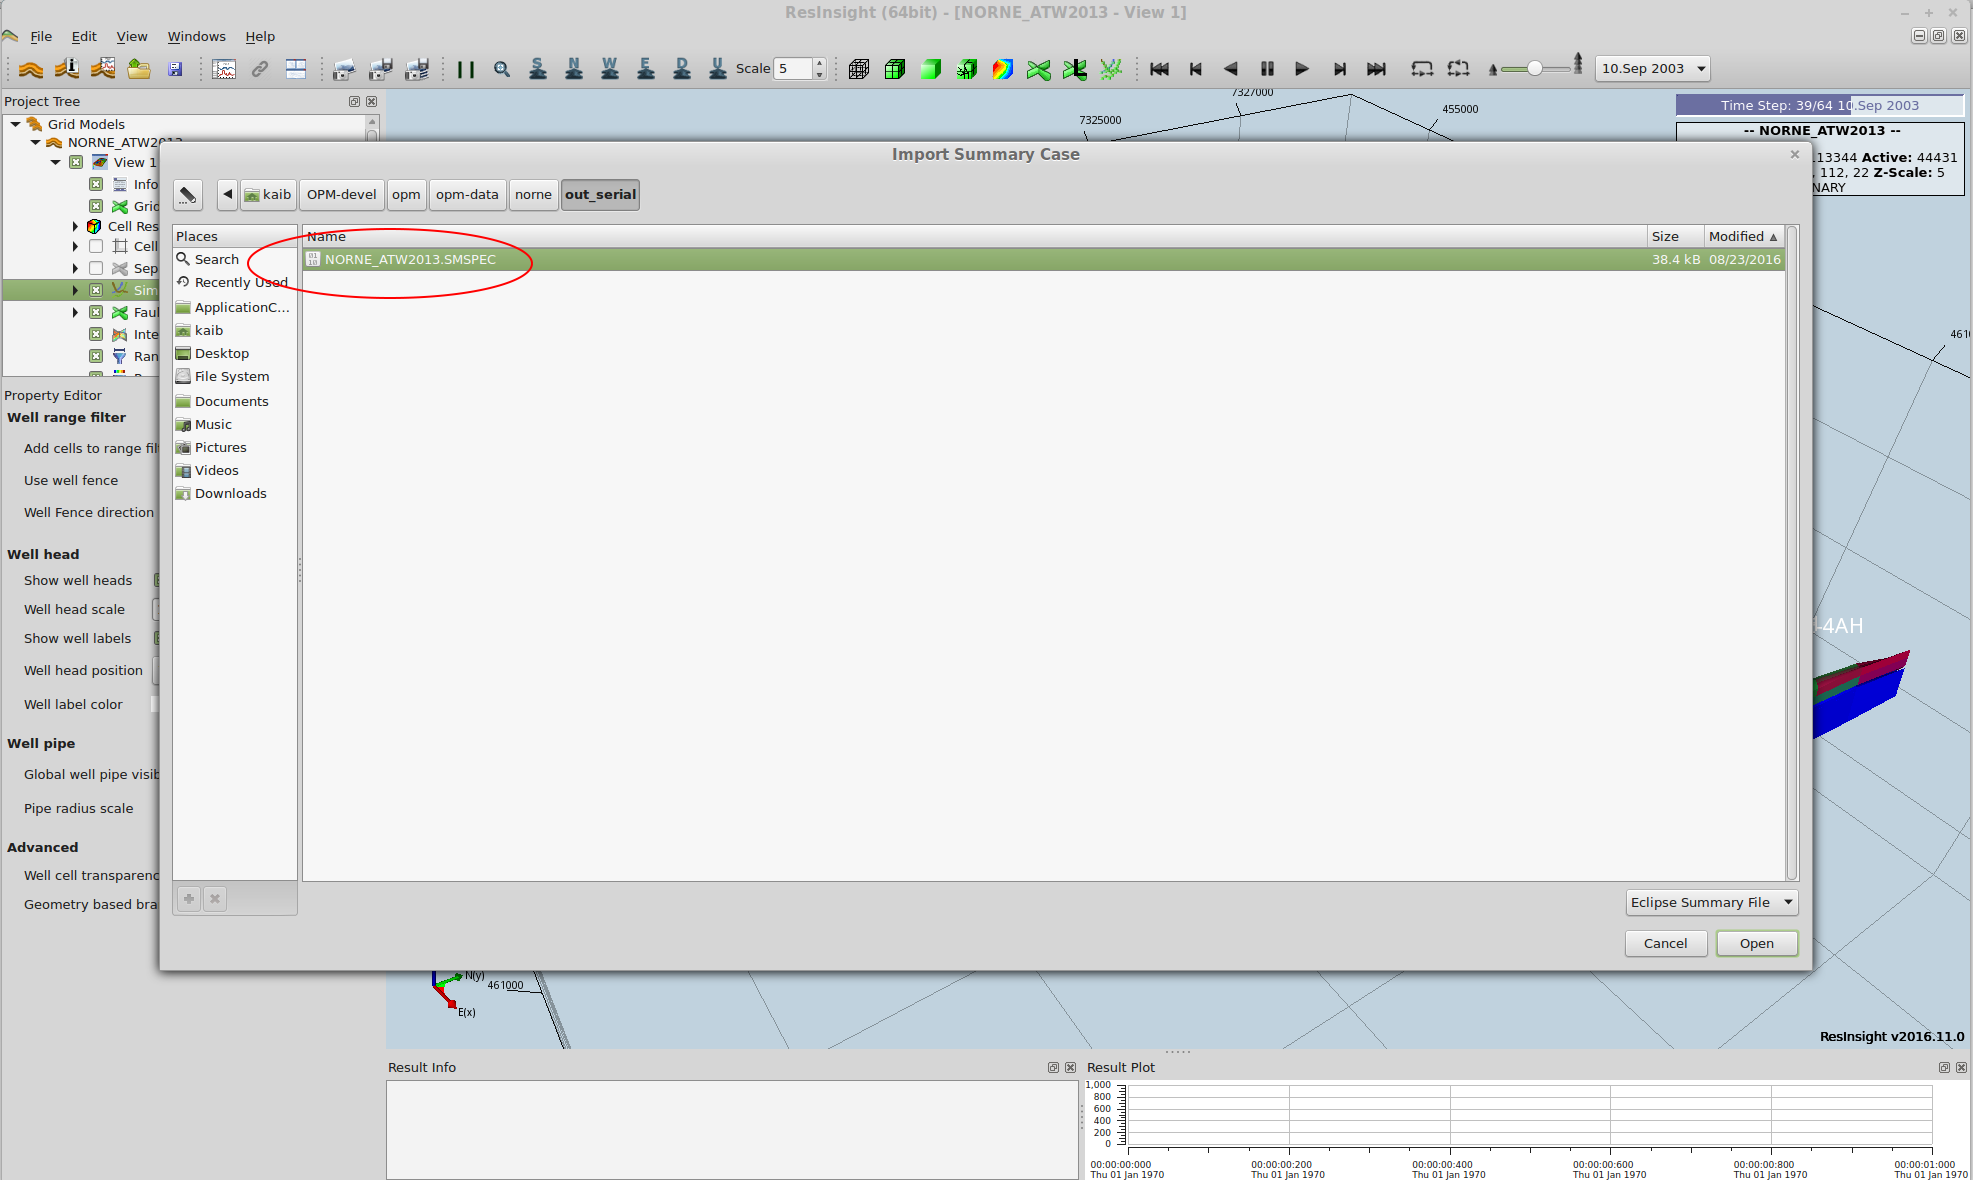
Navigate to the output directory and choose the SMSPEC file.
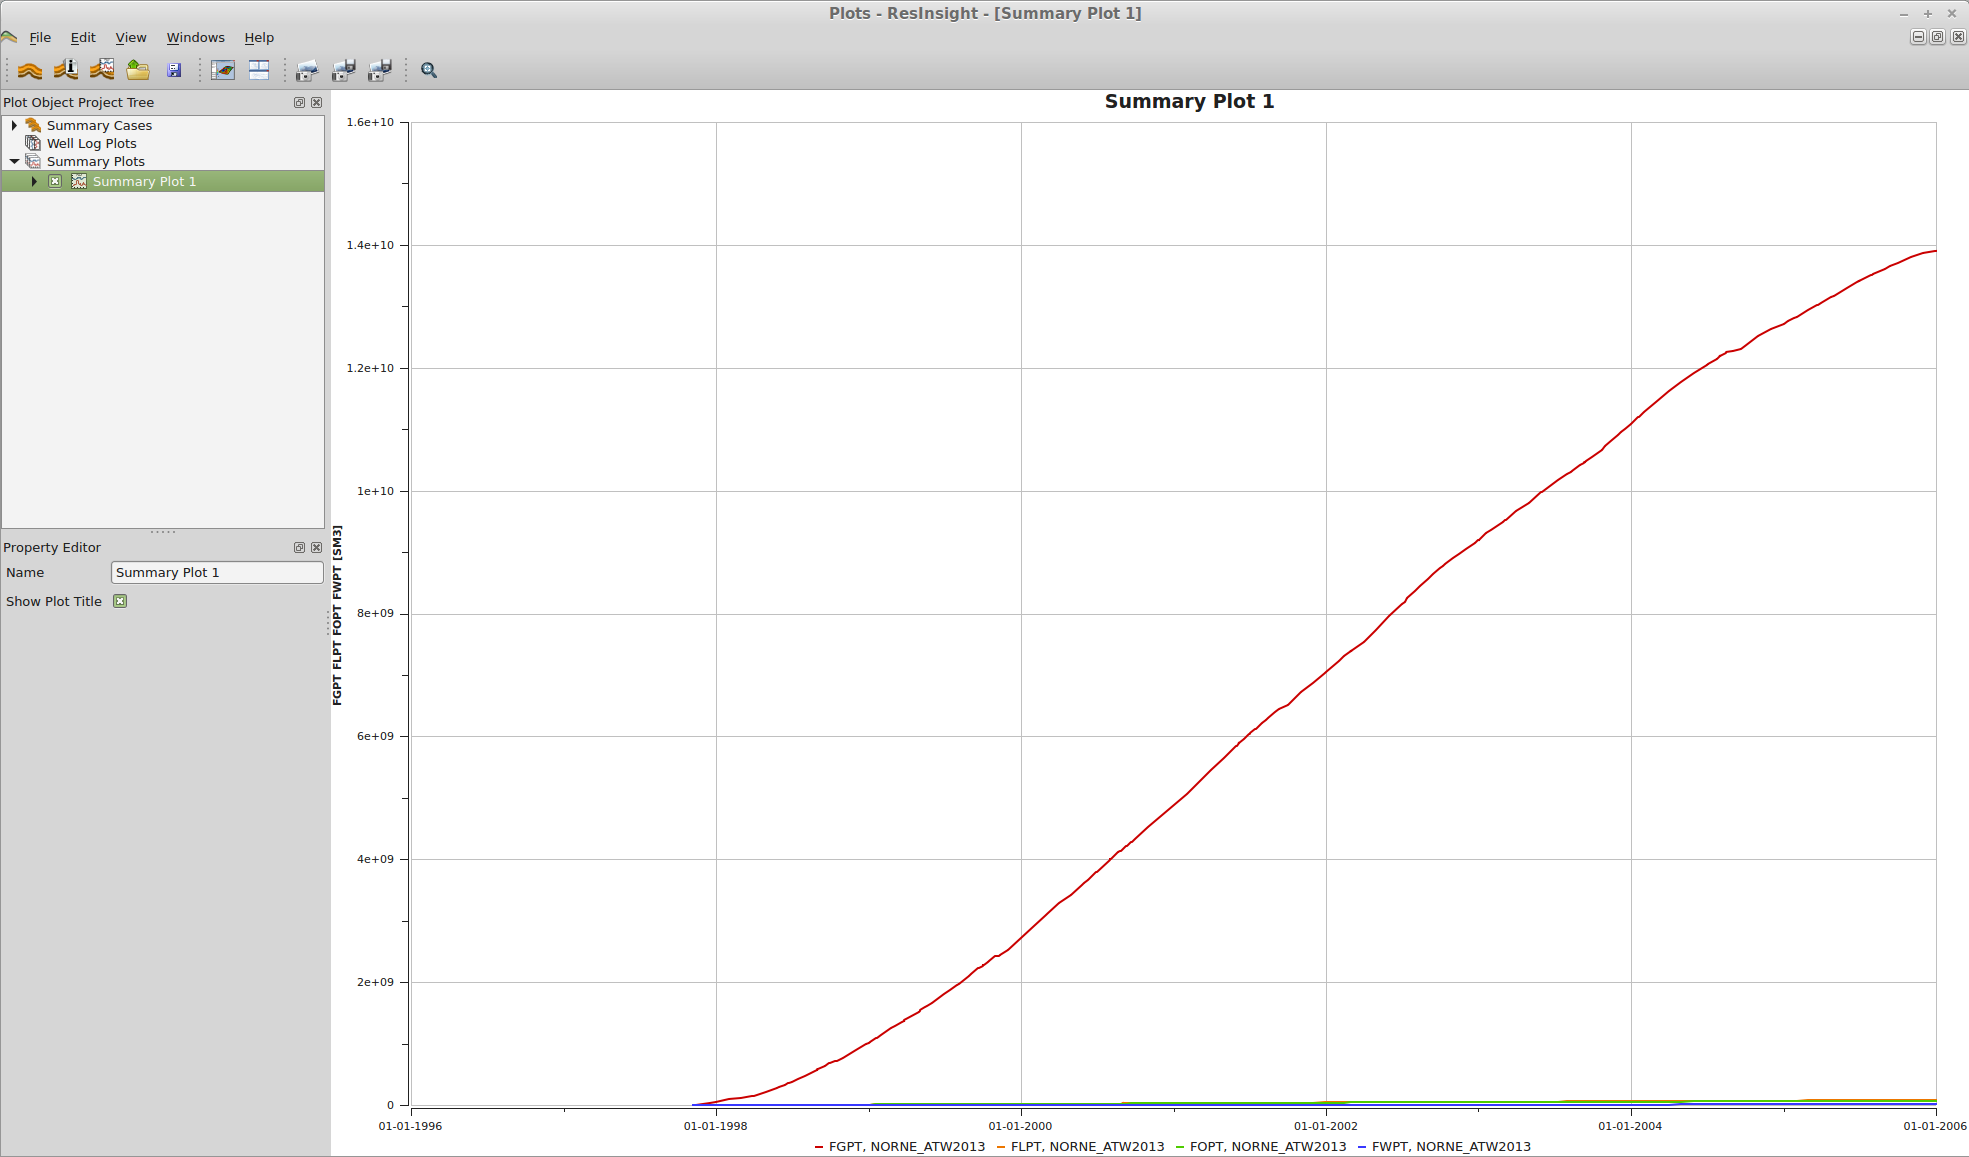
By default, field production rates for gas, oil, water and liquid (oil + water) are shown. The gas production curve dominates the others in this case, as should be expected since it is a case using METRIC and rates are therefore shown in cubic meters per day.
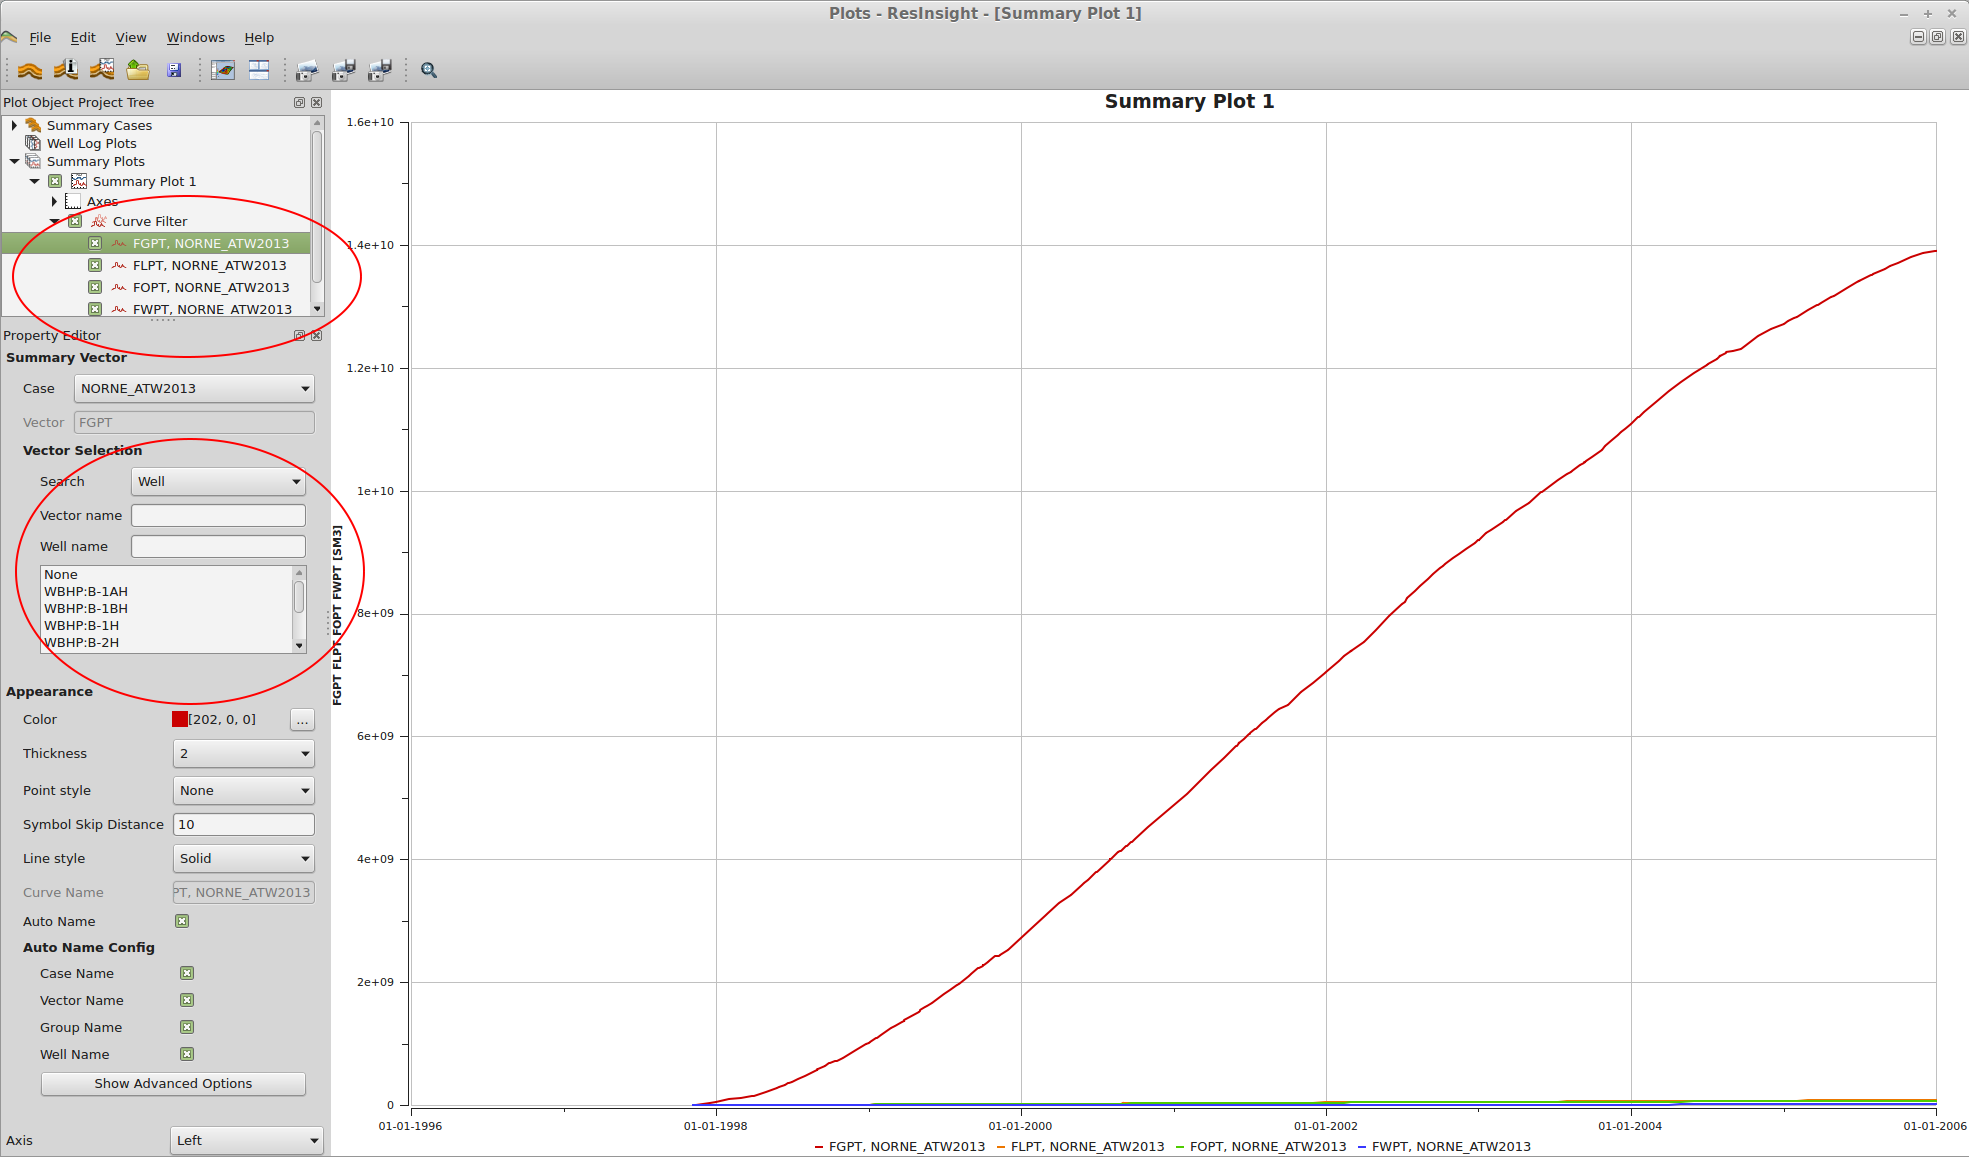
We’d like to inspect the bottom-hole pressure of the well B-1H. Expand Summary plot 1 in the Project Tree, delete the production curves and add the well BHP curve as shown below.
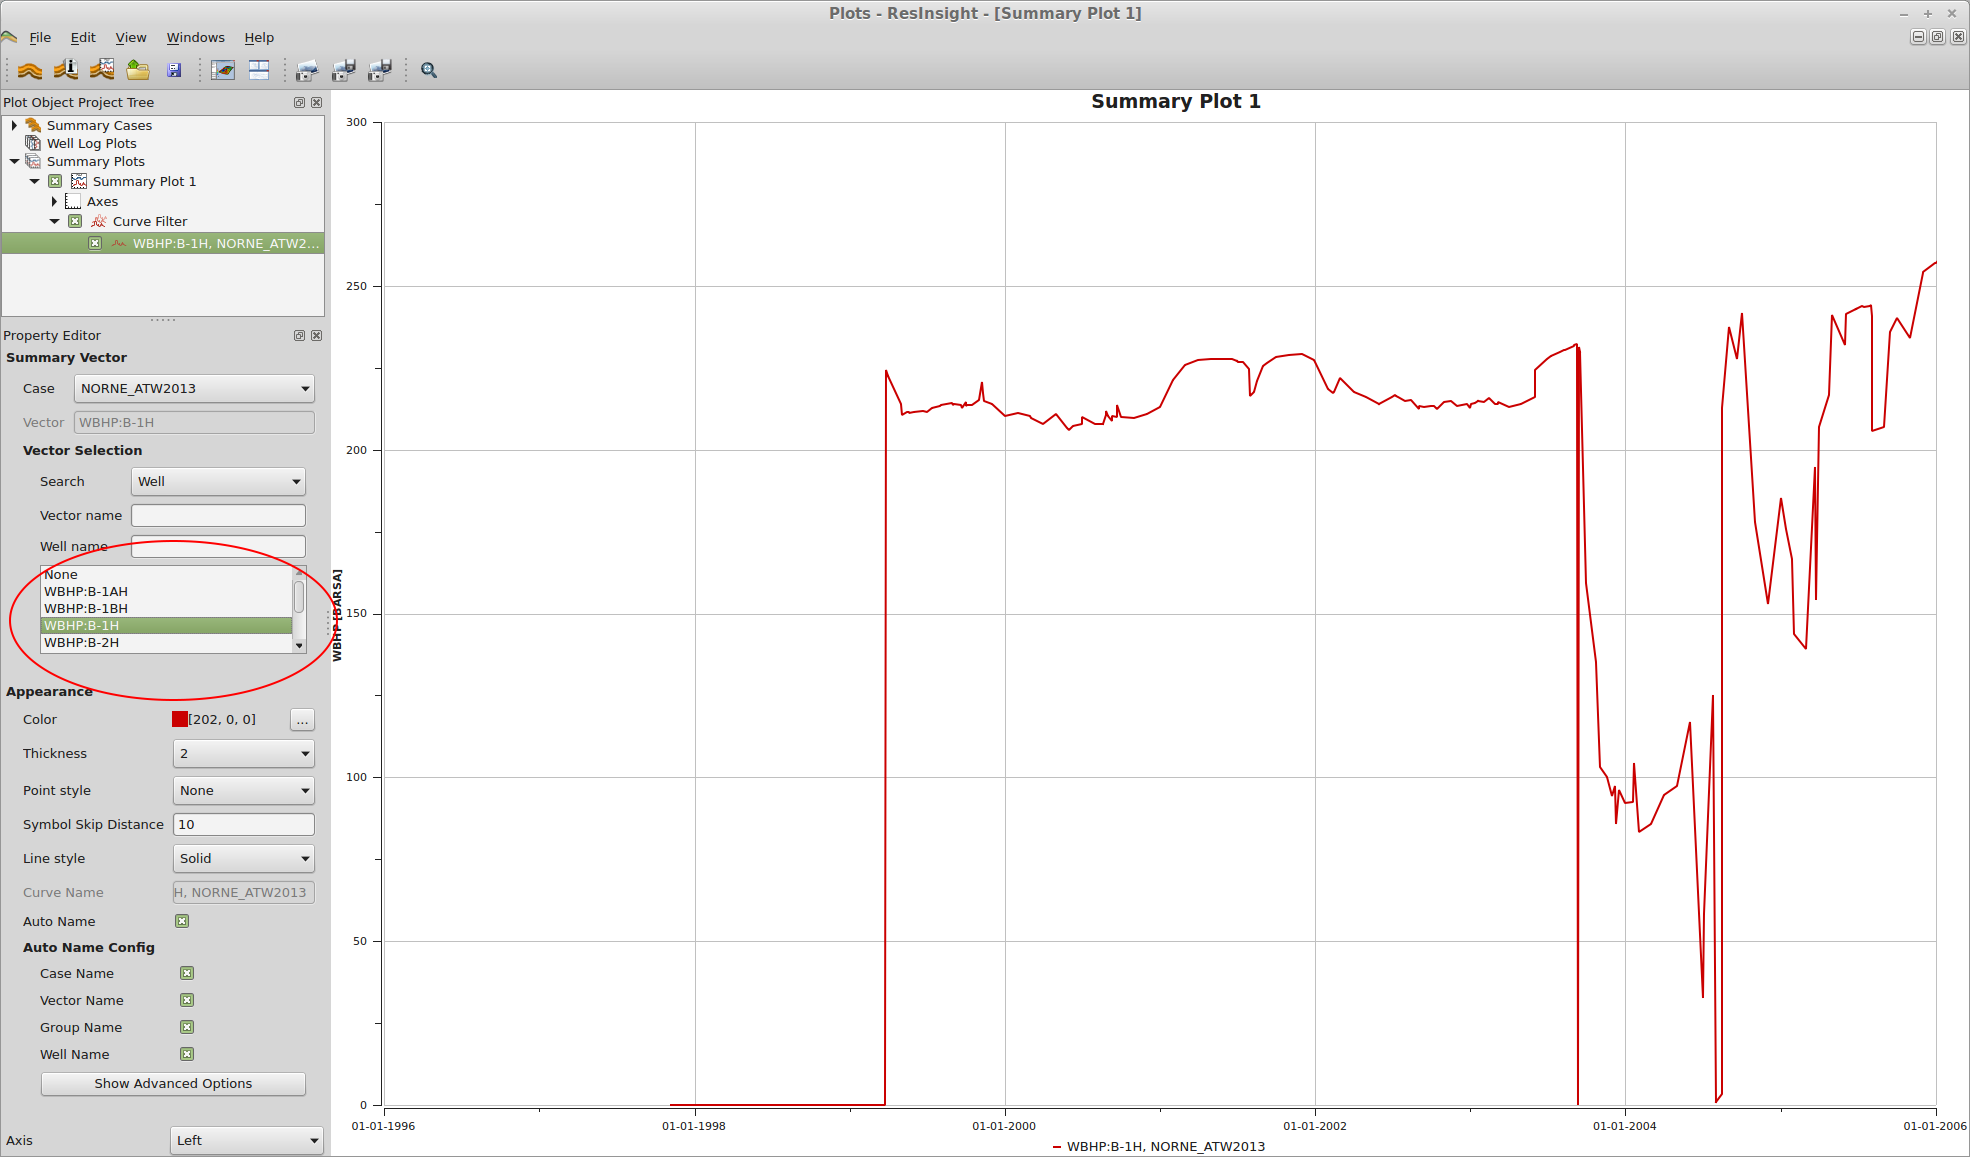
Now we are looking at the BHP curve we wanted to.
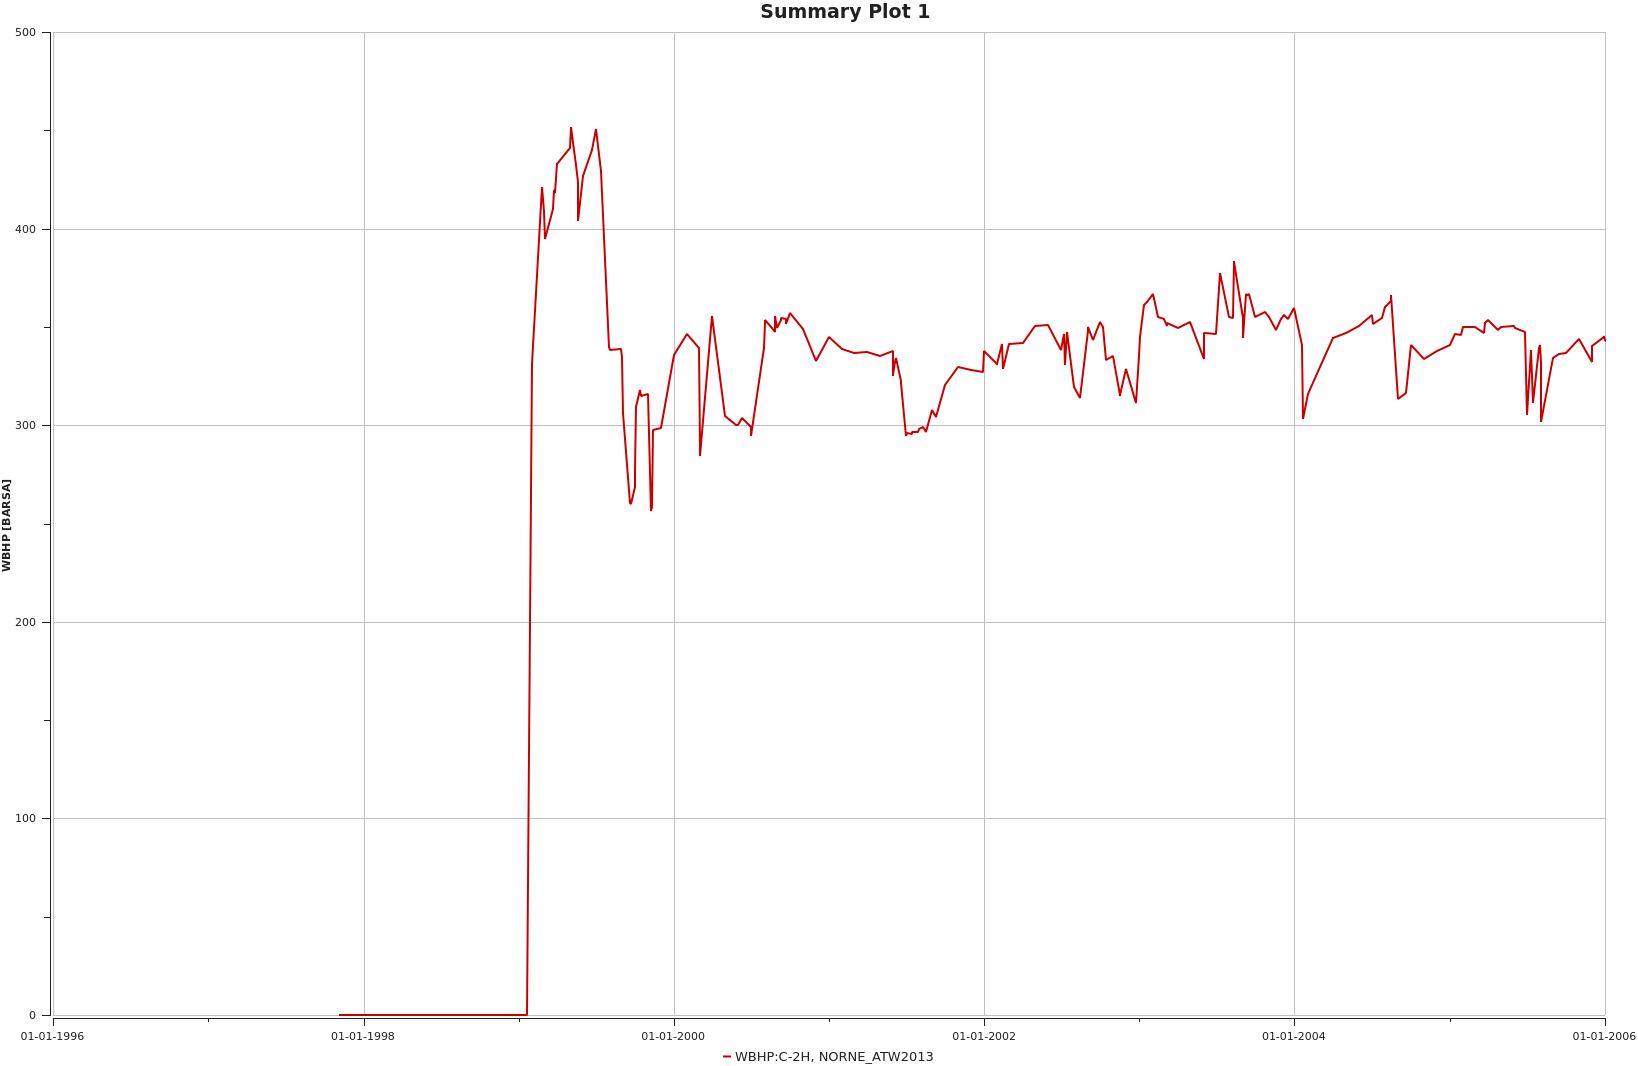
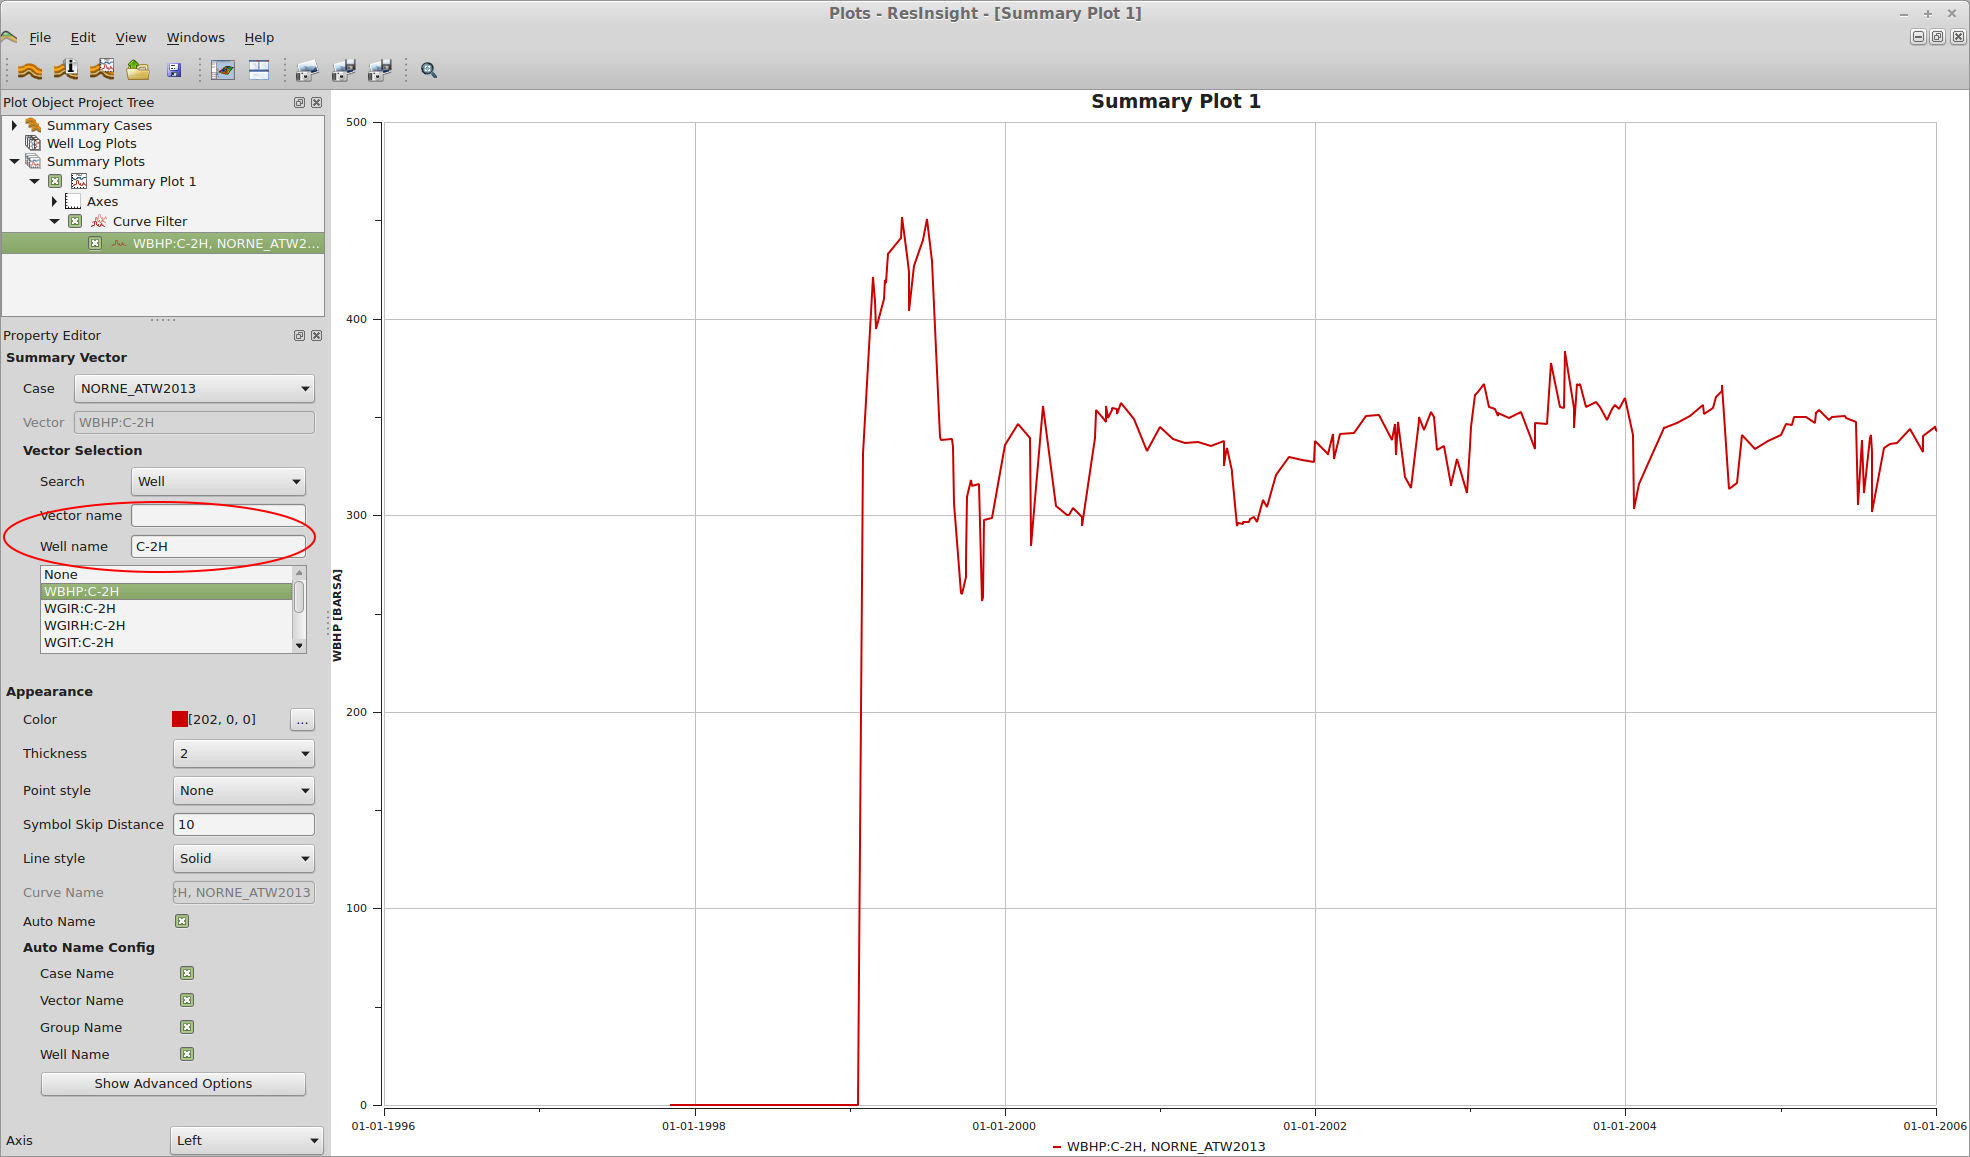
If we want to look at properties for a particular well, or a particular property, we can use a filter. Type the well name C-2H in the Well name field and the list of choices will be restricted to those relevant to that well. Choose WBHP:C-2H to see its BHP curve.
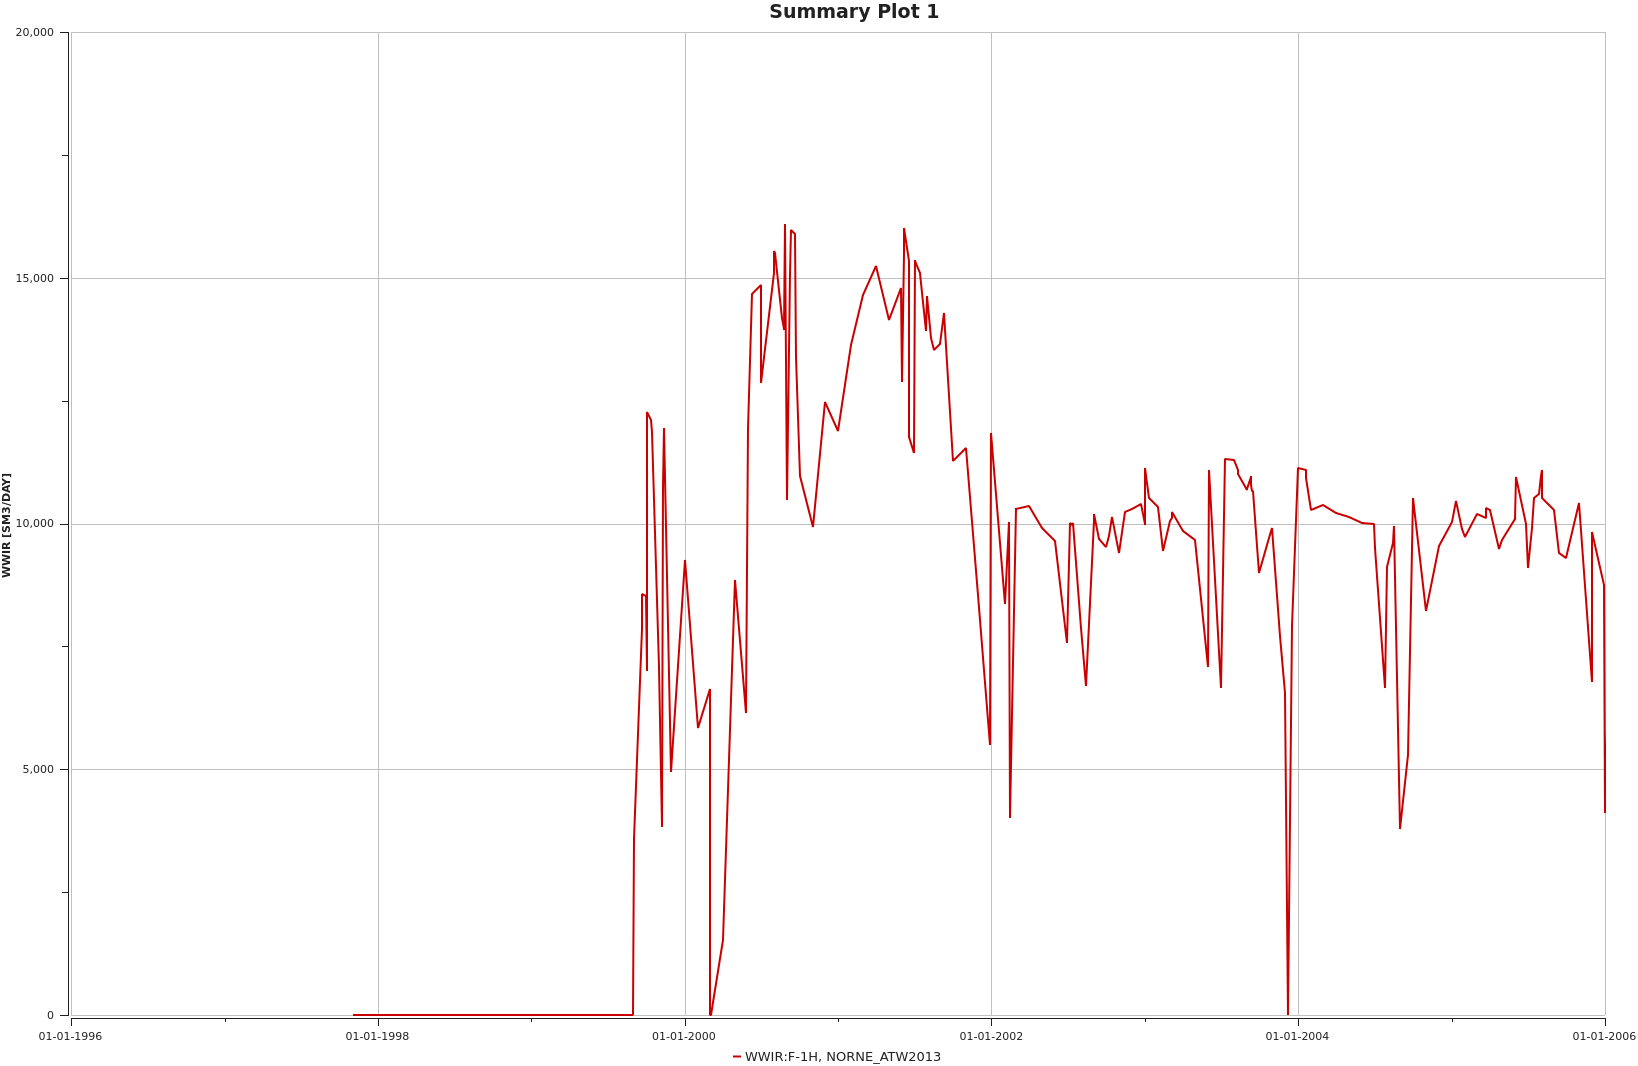
ResInsight can export these images easily. In the Edit menu, choose Snapshot To File to export them to files. You can see a few examples below.