Here, we would like to share with you some of the many cases we have studied with OPM software. This way, we seek to highlight features and capabilities that are not described in tutorials.
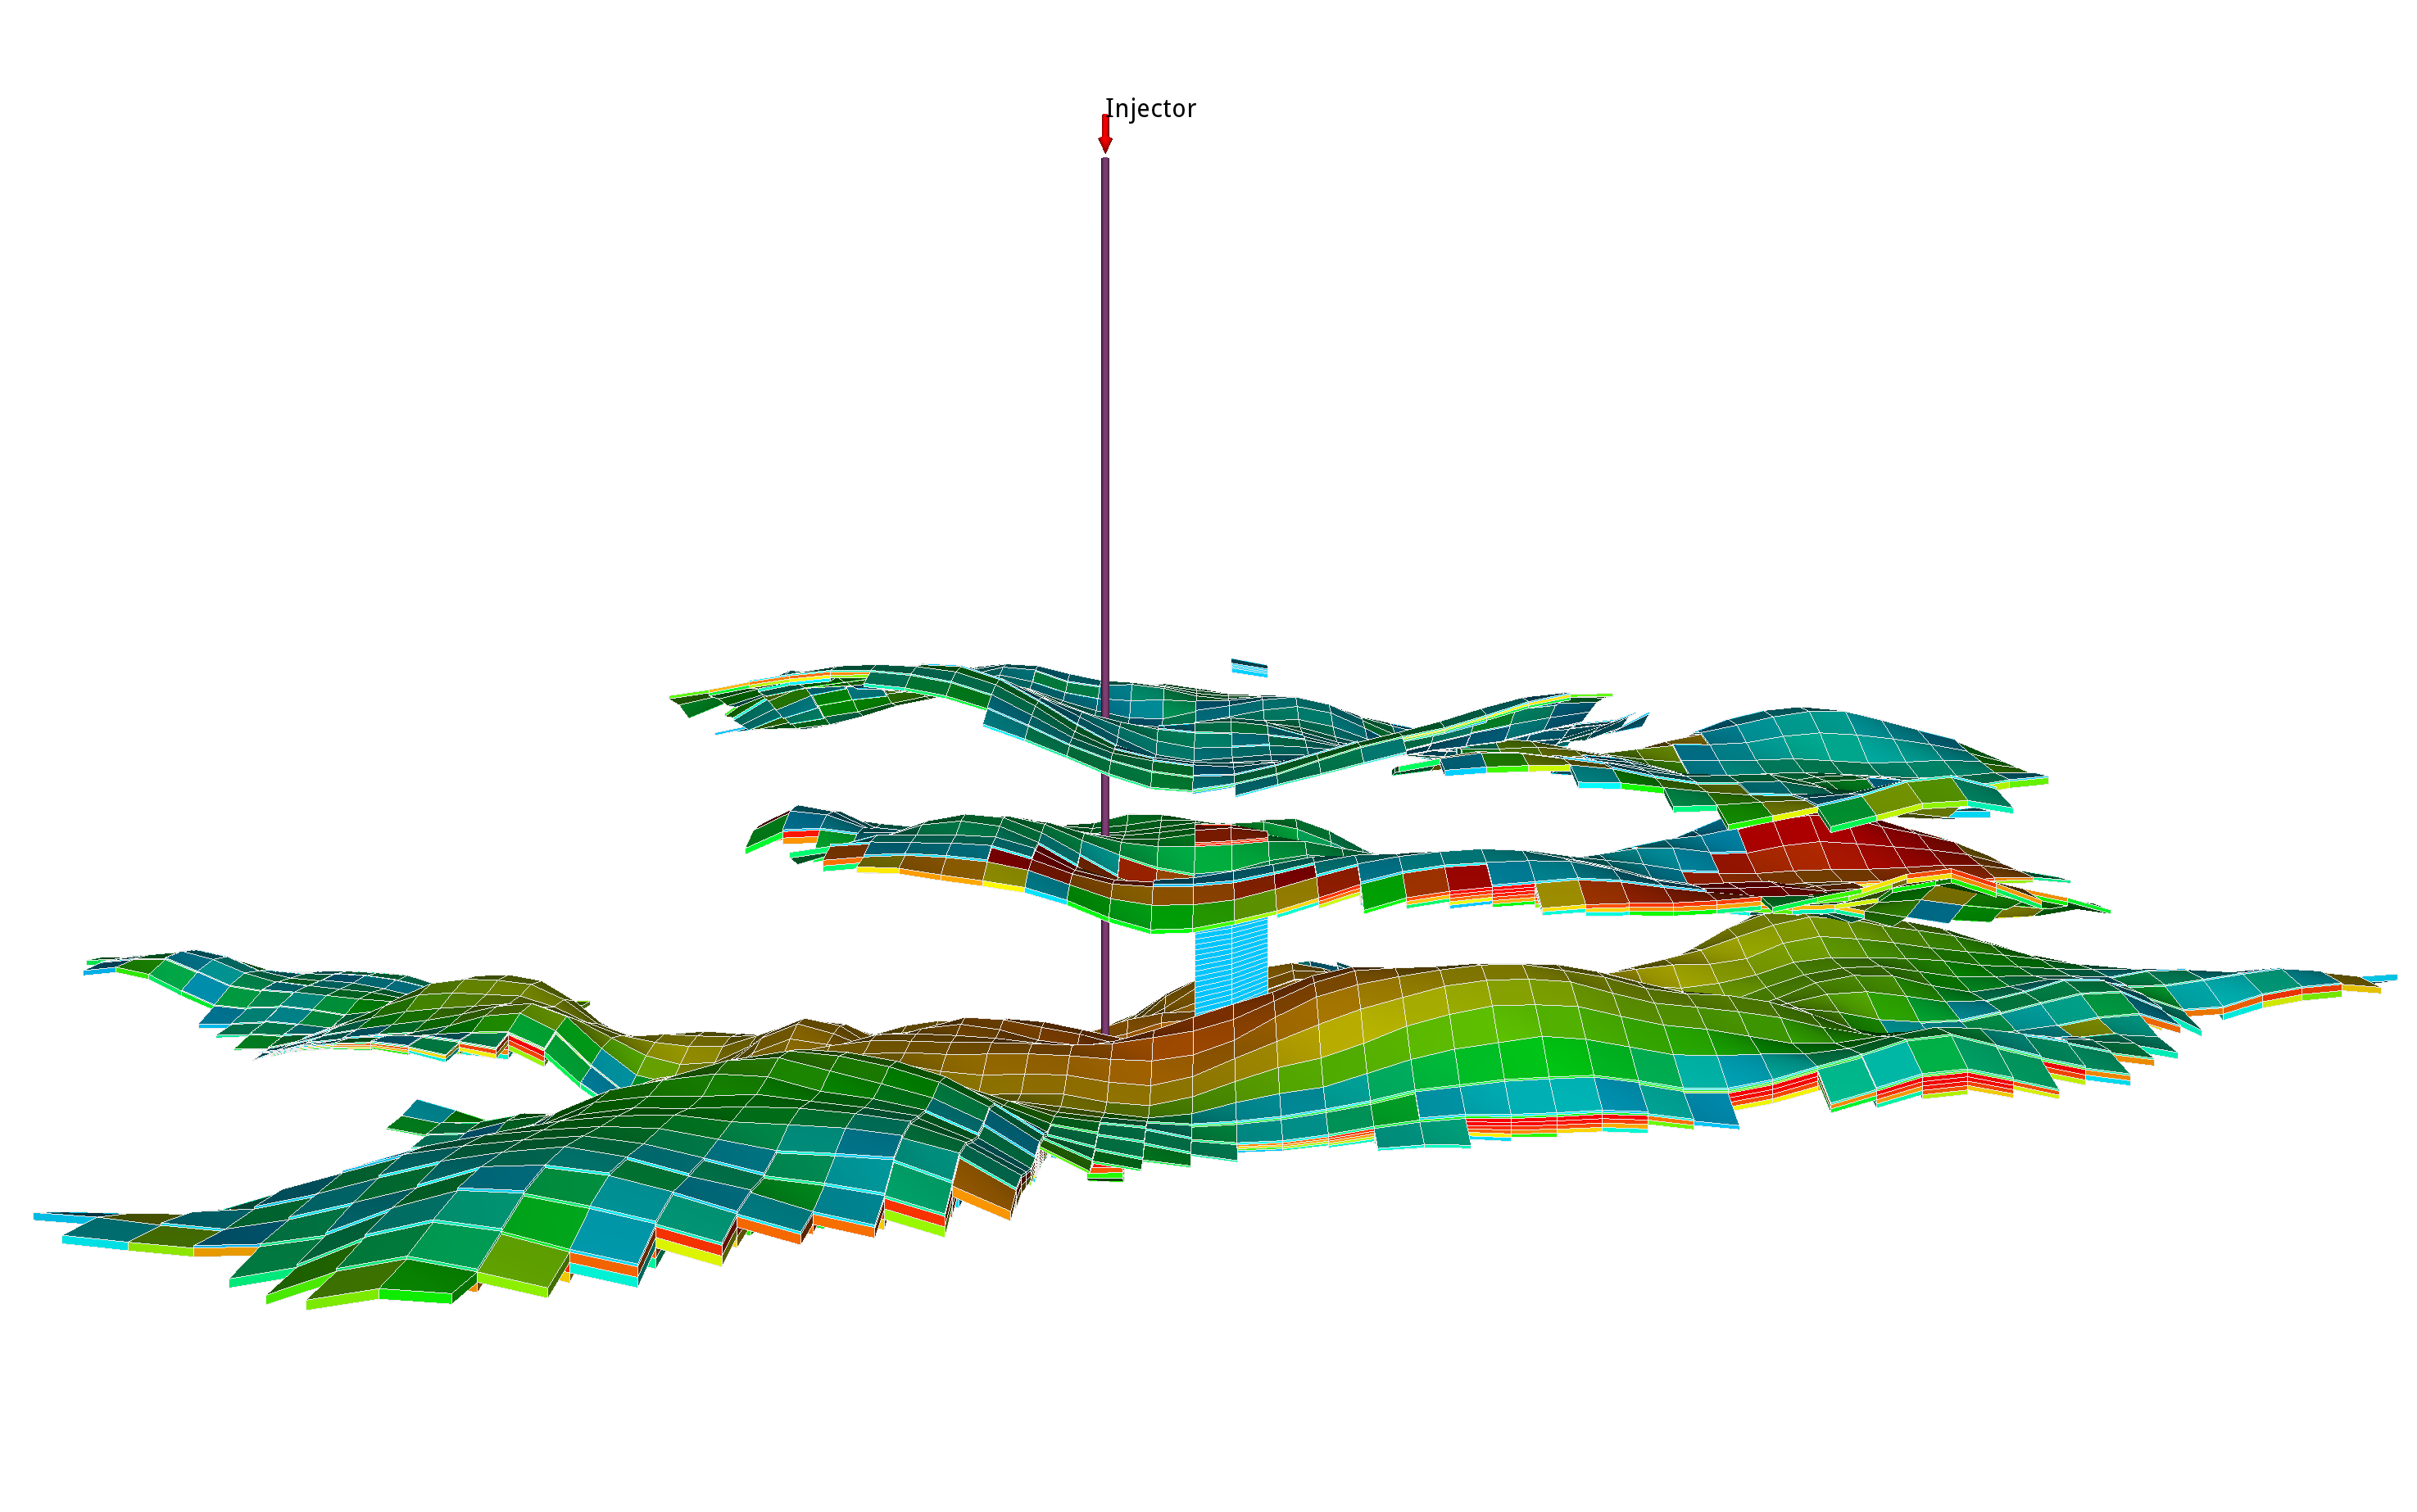
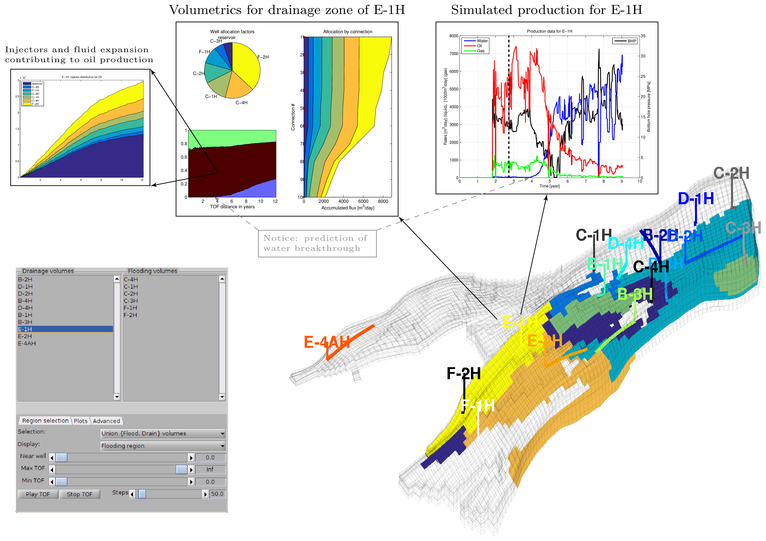
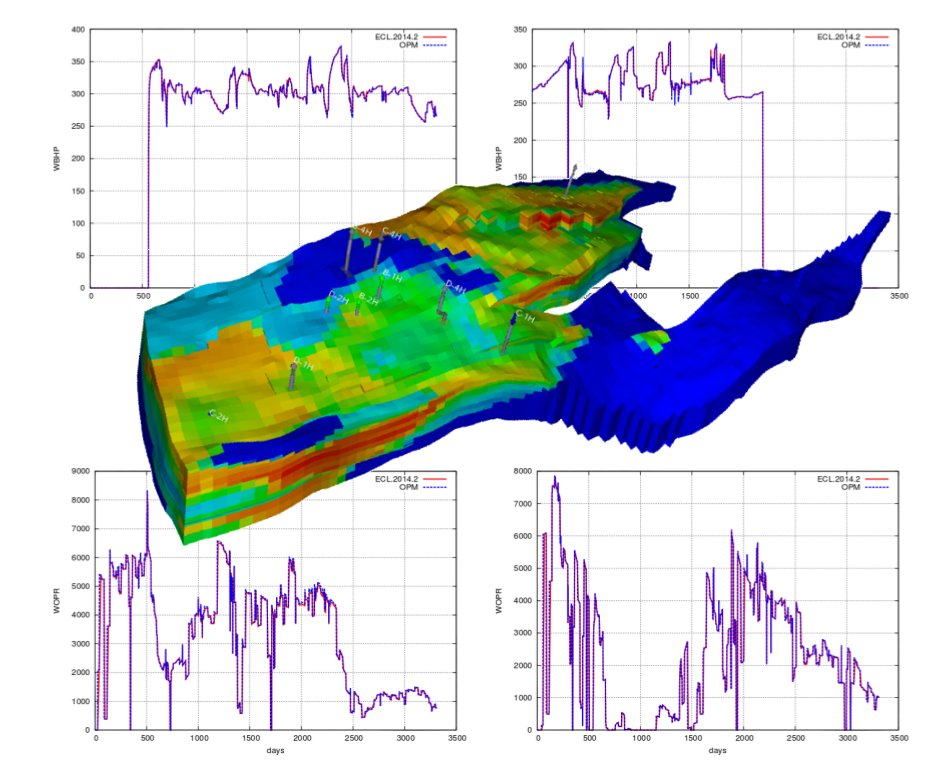
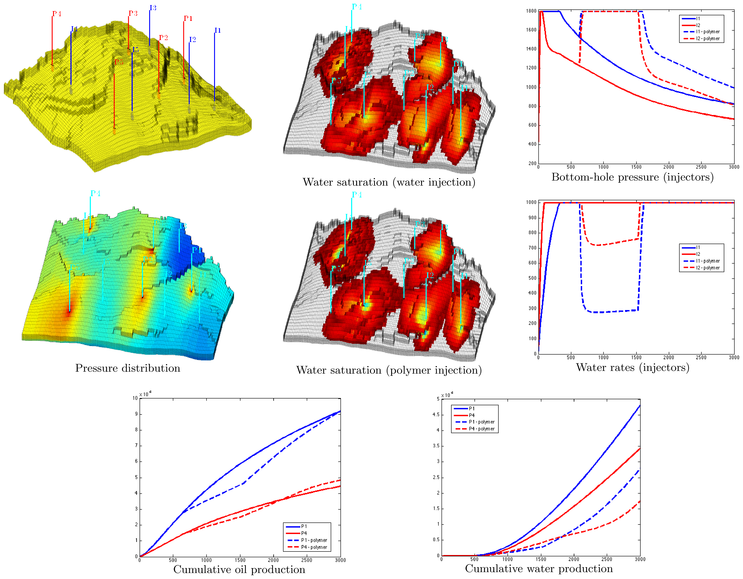
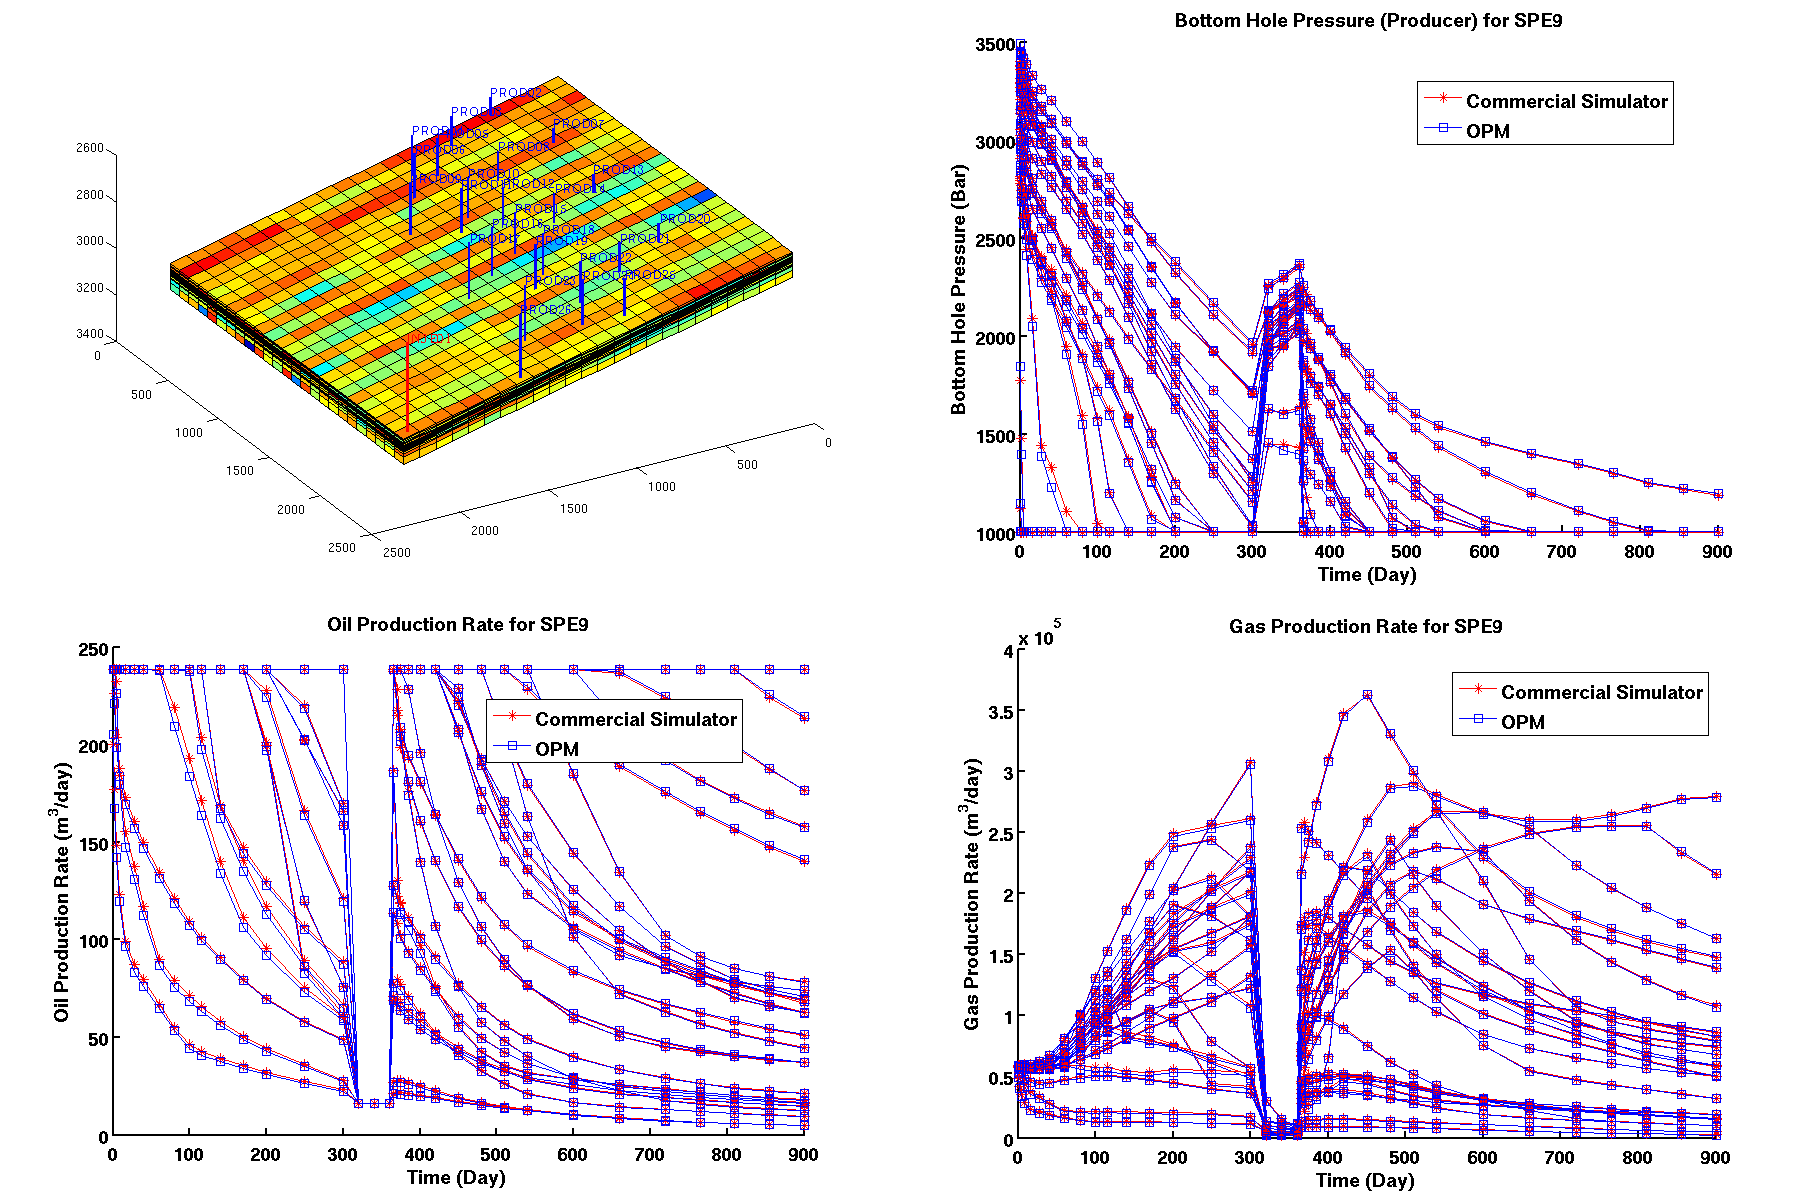
CO2 injection plume on the Sleipner benchmark case, after 14 years of injection. Simulated using the CO2STORE option.Use of flow diagnostics tool from MRST to identify and visualize volumetric connections within the Norne field. OPM offers the basic solvers needed to compute flow diagnostics, and work is in progress to develop similar capabilities for visual analysis in ResInsight.Validation of Flow for the Norne Field. The 3D plot shows saturation distribution visualized in ResInsight. The line plots show bottom-hole pressures and oil-production rates as computed by Flow (blue lines) and Eclipse 100 (red lines).Comparison of water and polymer flooding for a synthetic shallow-marine reservoir from the SAIGUP project. The OPM solver assumes incompressible flow and uses a sequentially implicit solution procedure with optimal ordering of the unknowns in the transport equation to reduce computational time. In the polymer simulation (dashed lines), we see that the bottom-hole pressure increases and the injection rates decreases during the injection of the polymer slug. This, in turn, gives less oil production during the slug injection, but the overall result is that less water is injected and produced from the reservoir over the simulated 3000 days period and the total oil production increases slightly. (Visualization by MRST)Validation of Flow on the SPE9 benchmark. The model is quite small, but contains a few features that will still pose challenges for black-oil simulators. The well pattern consists of 25 rate-controlled producers and one injector. Between days 300 to 360, the injection rates are lowered. Free gas is form after approximately one hundred days as the reservoir pressure is reduced below the original saturation pressure and migrates to the top of the reservoir. During the simulation, most of the wells convert from rate control to pressure control. A second problem is a discontinuity in the water-oil capillary pressure curve, which may cause difficulties in the Newton solver when saturations are changing significantly. The figure shows that Flow provides excellent match with Eclipse 100.Validation of Flow on the SPE1 benchmark case. The reservoir is initially undersaturated and filled with a uniform mixture of water and oil with no initial free gas and a constant dissolved gas-oil ratio throughout the model. Gas is injected in the top layer.