Visualizing the solution with ResInsight
Note: the rest of this guide was made with a version of ResInsight that is no longer current, the current version looks different, although the principles should be the same.
The field data (3D data, typically per cell) is typically written to restart files. For the current case, you will find this in the file NORNE_ATW2013.UNRST (a unified restart file).
We will now open the case in ResInsight to look at some solution variables. You can click on the pictures to see a larger version.
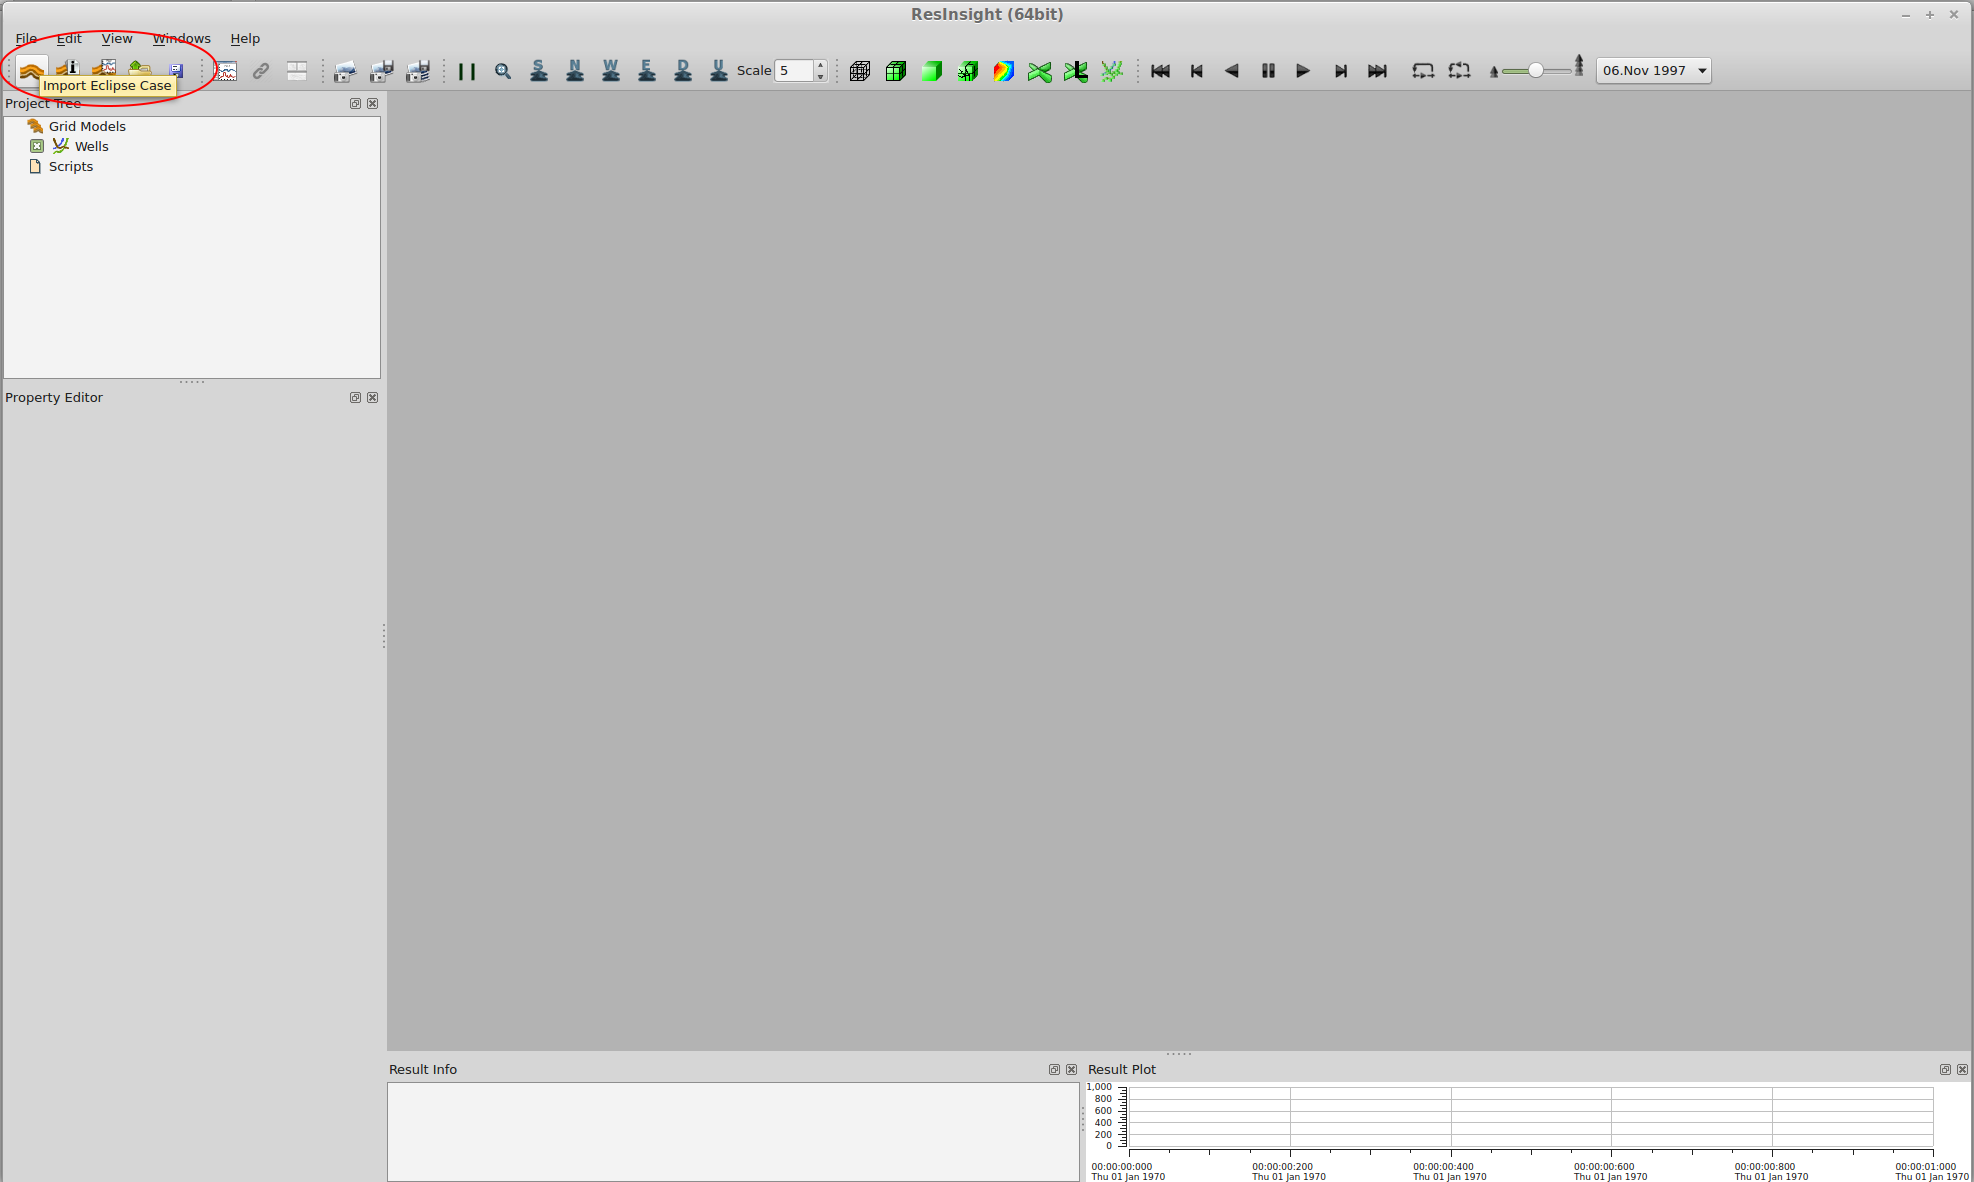
First we need to import the case. Click the Import Eclipse Case button.
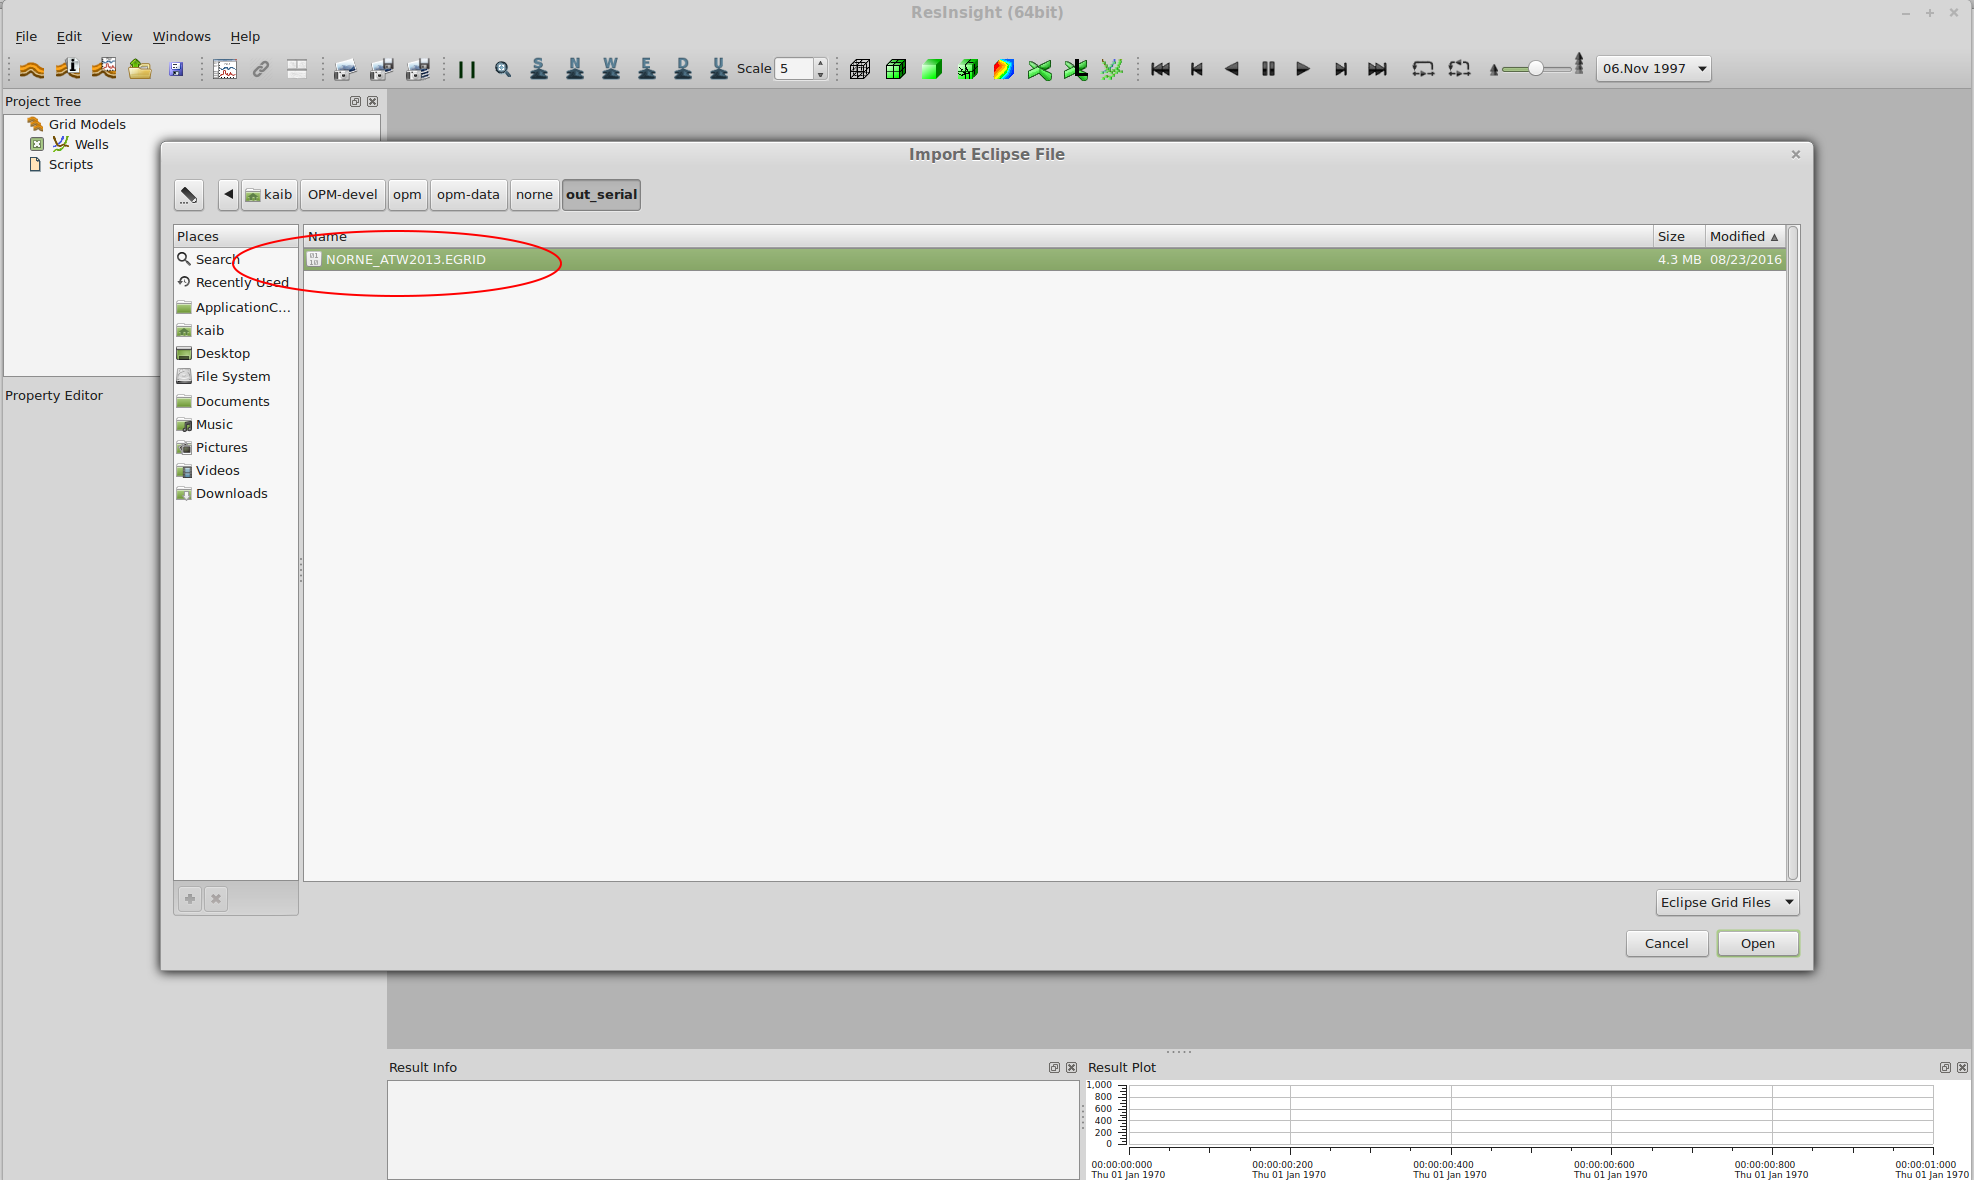
Navigate to the directory containing the output (out_serial if you followed the instructions earlier) and choose the EGRID file.
The case should open, looking like this:
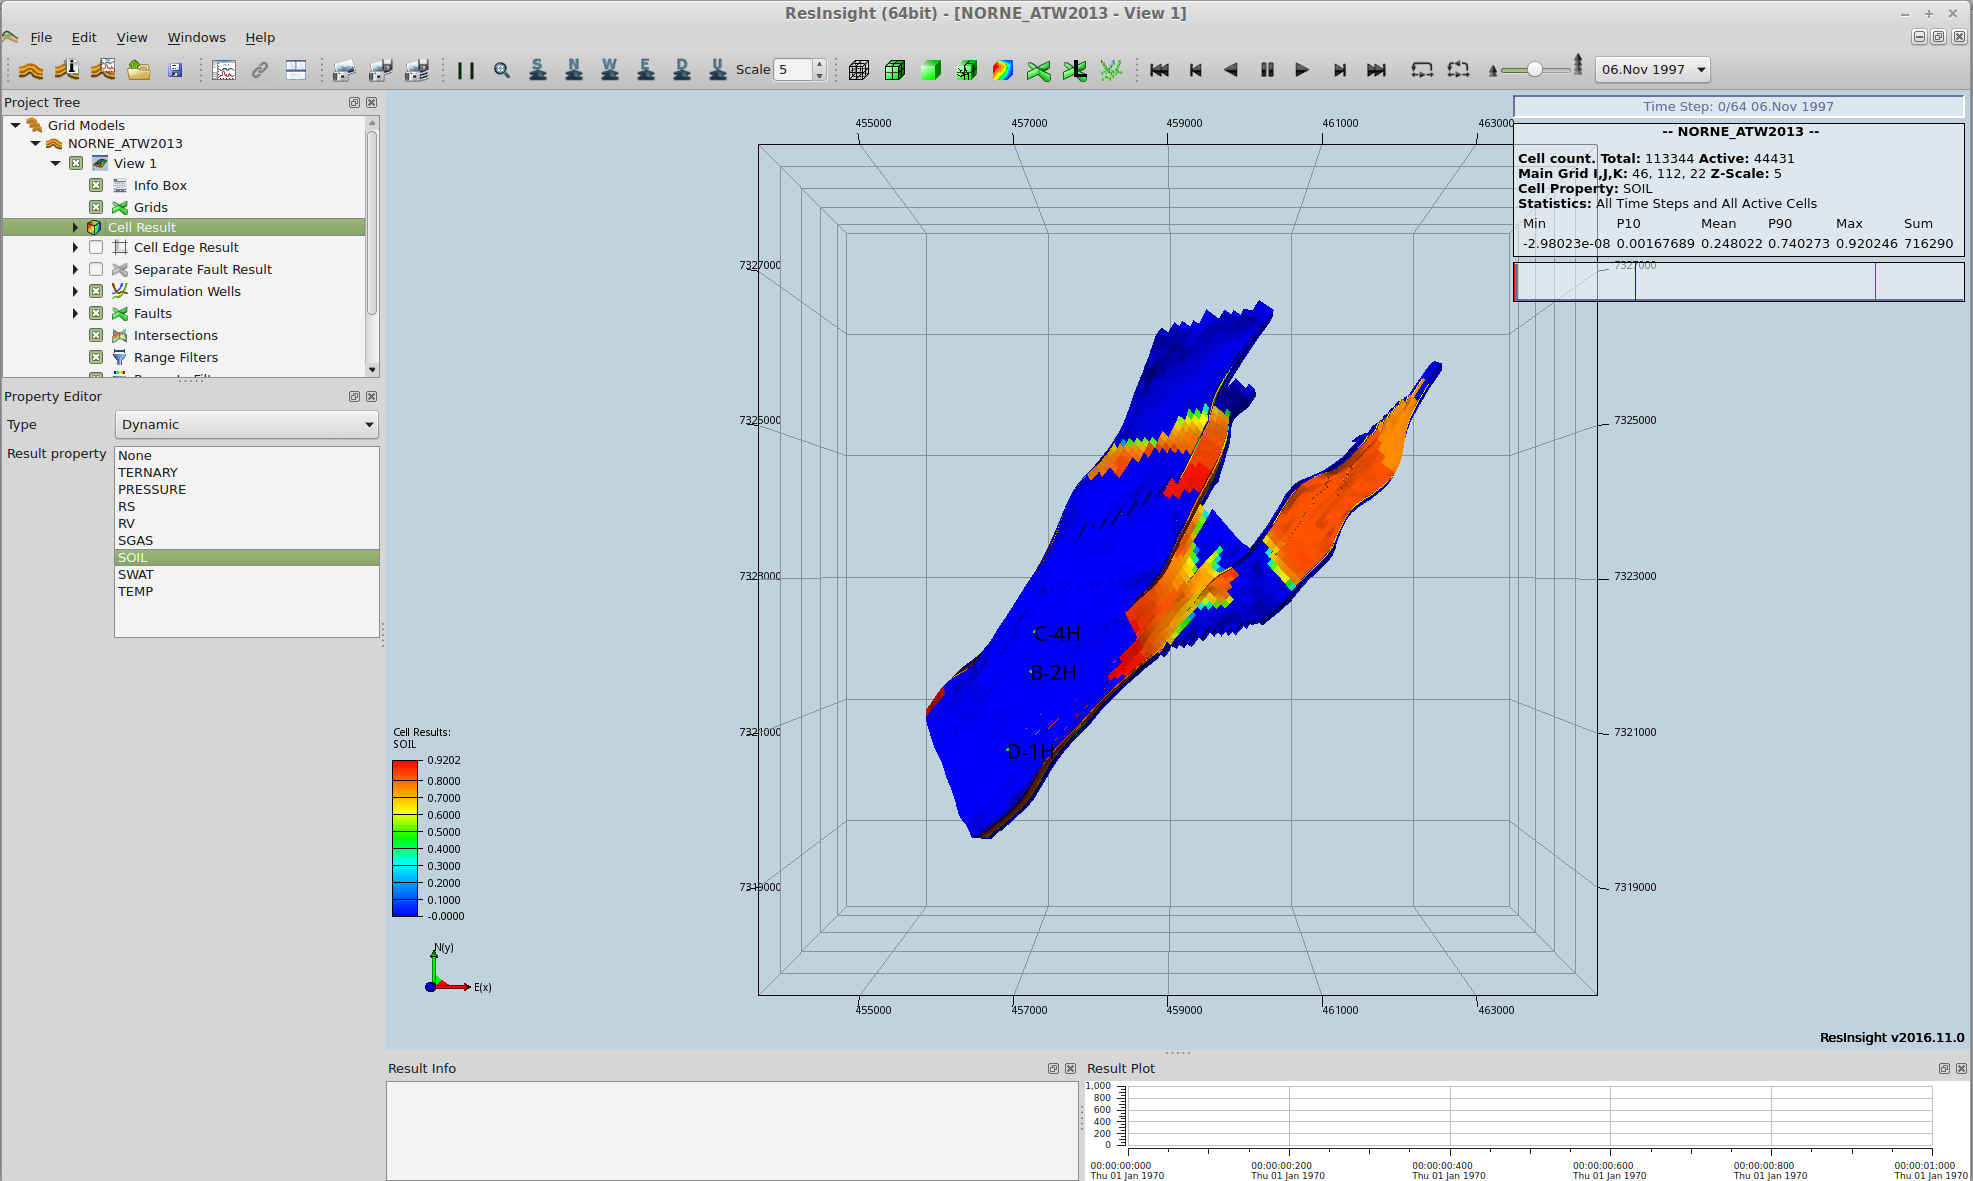
You can rotate and zoom to get a better view. Use the right mouse button to rotate, the middle button to zoom and the left button to move the view.
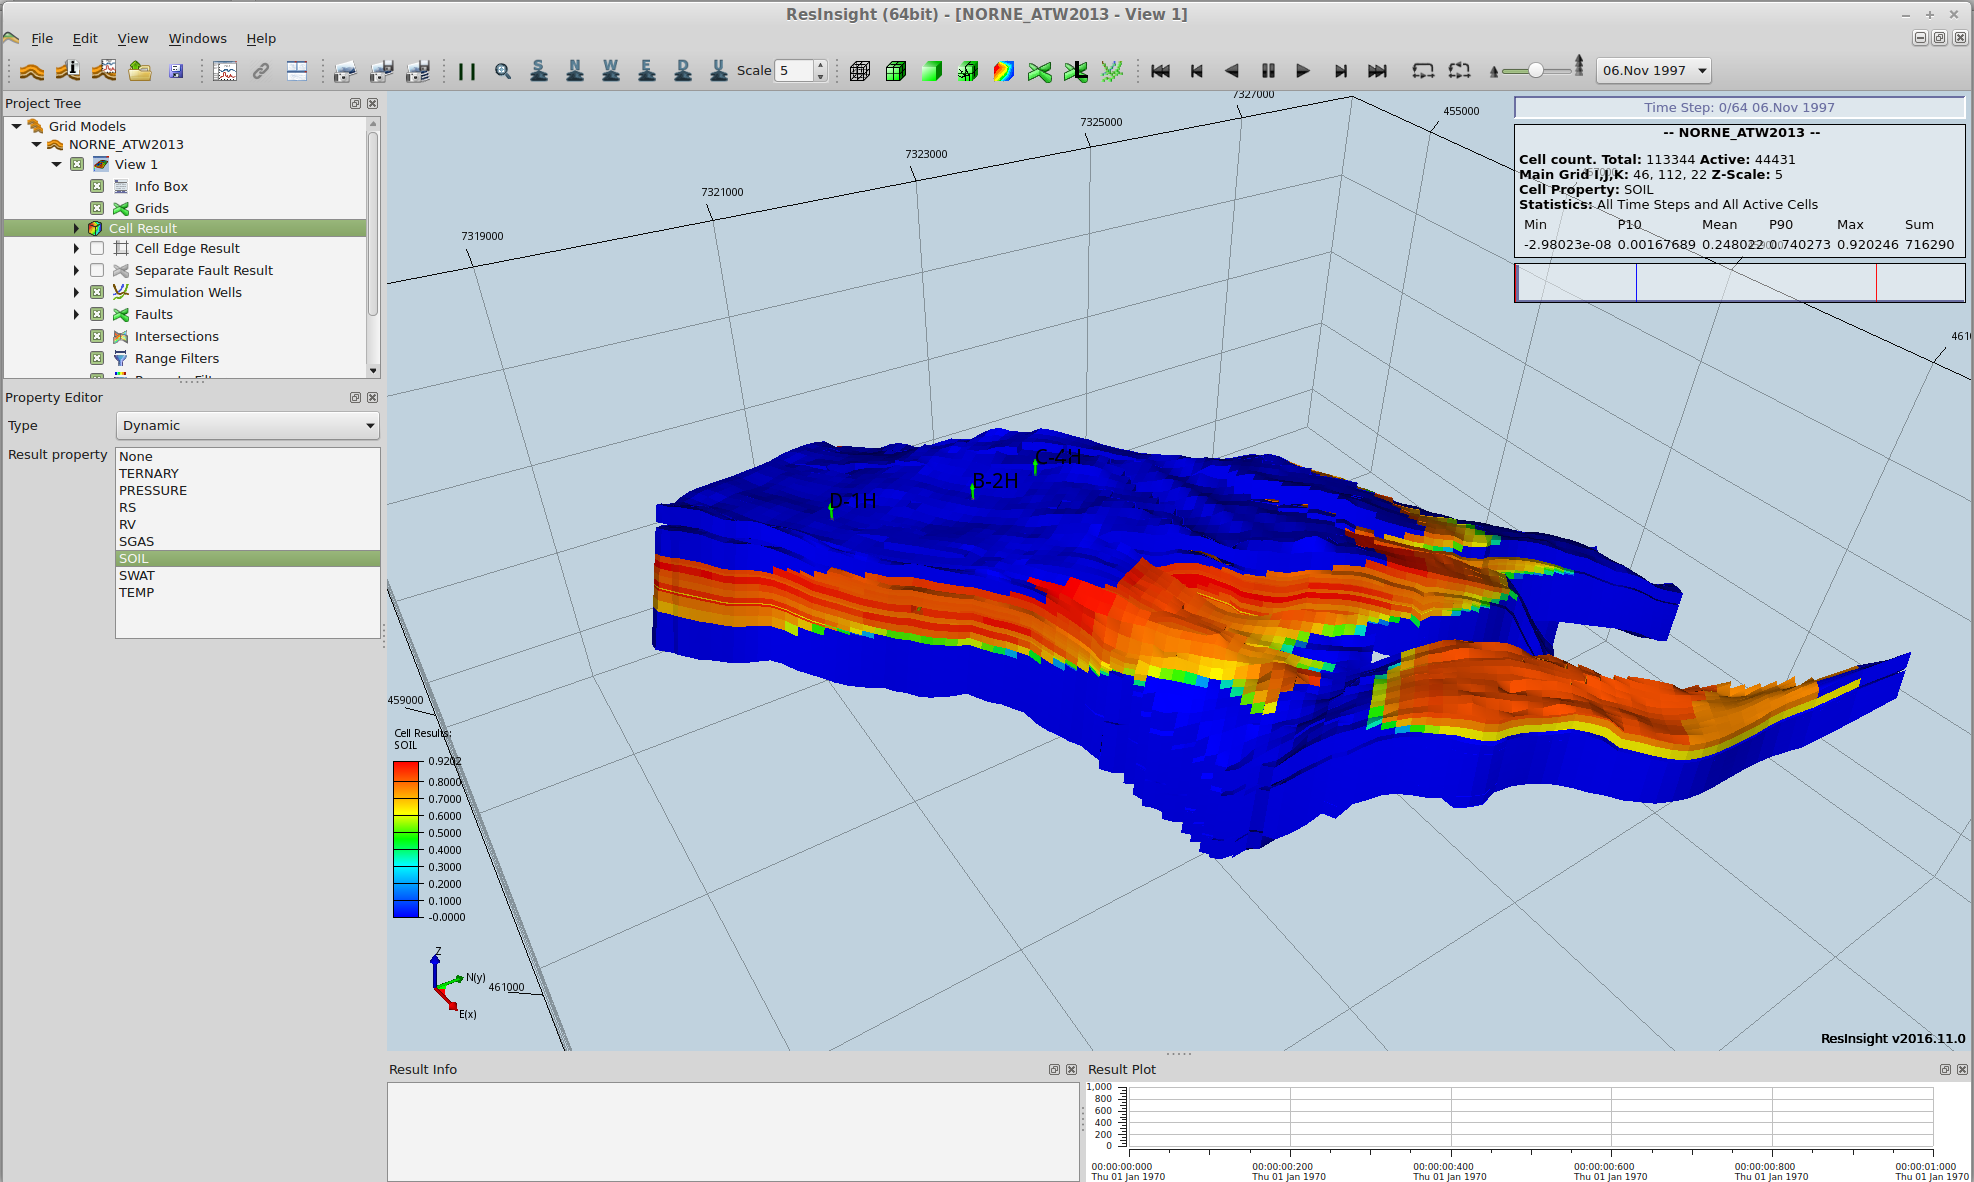
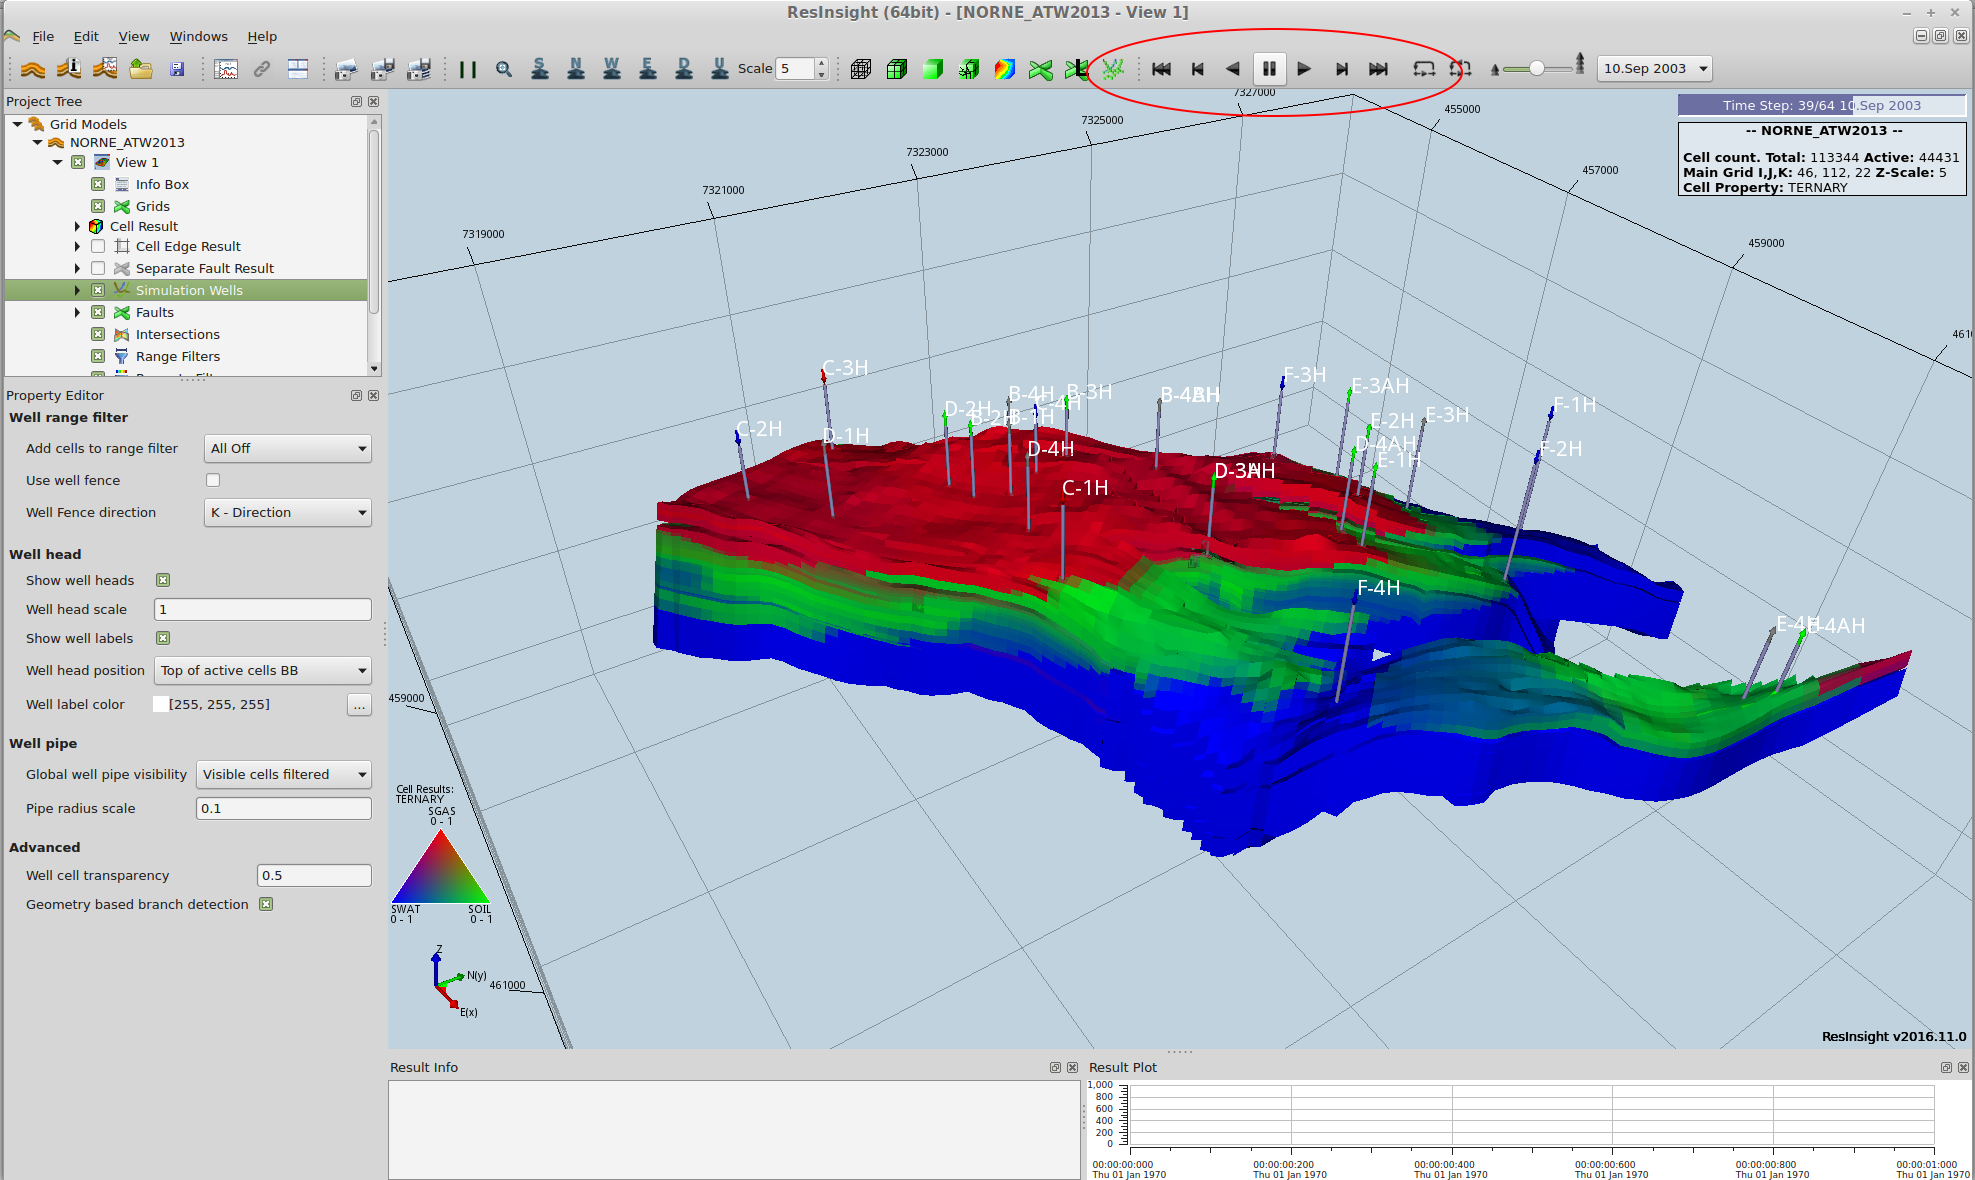
By default, we are looking at the oil saturation. Now we want to look at all phase saturations using a ternary color scheme. Click on the TERNARY line in the property editor.

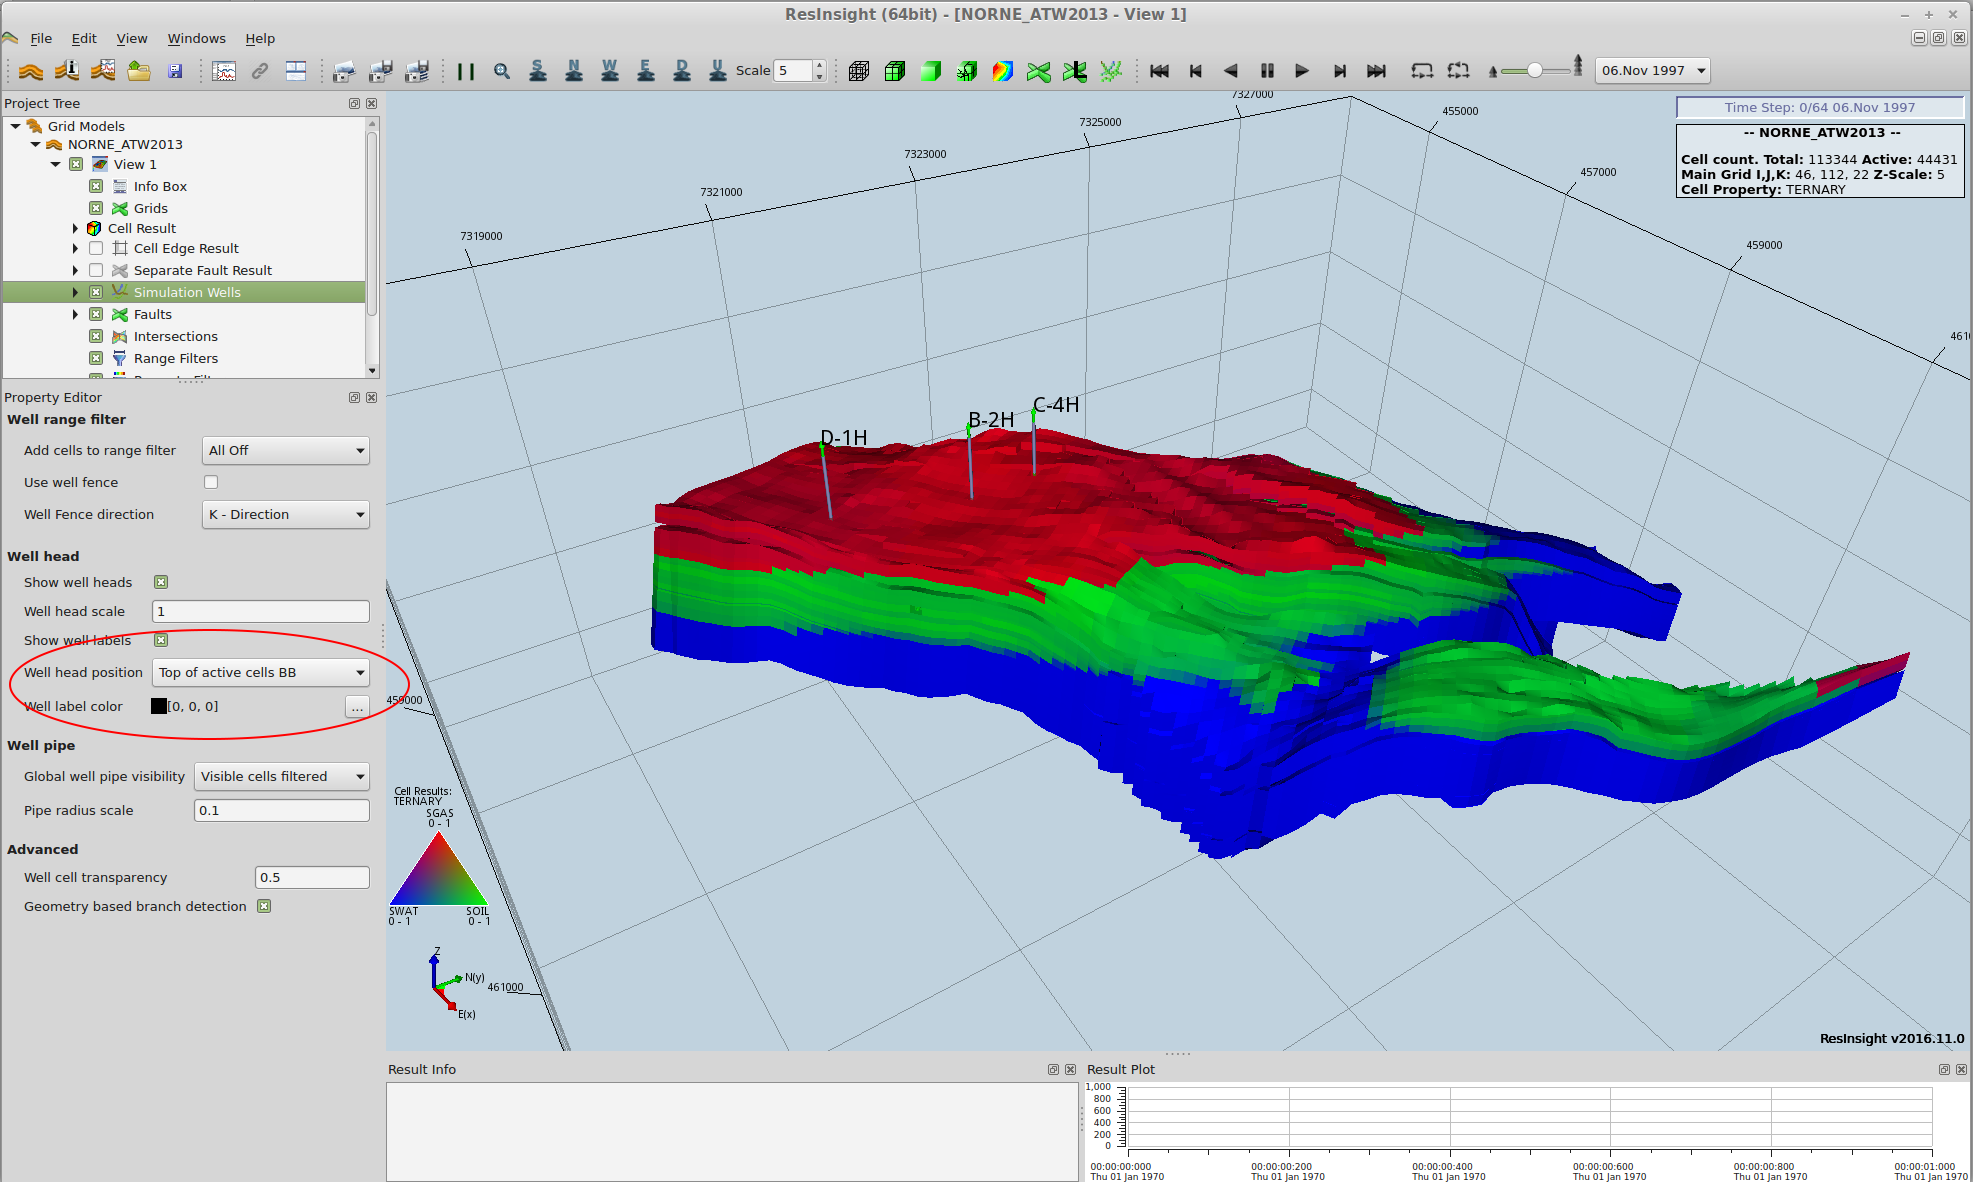
The wells are not as visible as we’d like, so we will change how they are displayed. Click Simulation Wells in the Project Tree view, then choose Top of active cells BB for Well head position. Now the well heads are shown at the edge of the full bounding box, and stand out better. Also we’ll change the Well label color to white.
Then we’ll animate the results, click the Play button as shown.
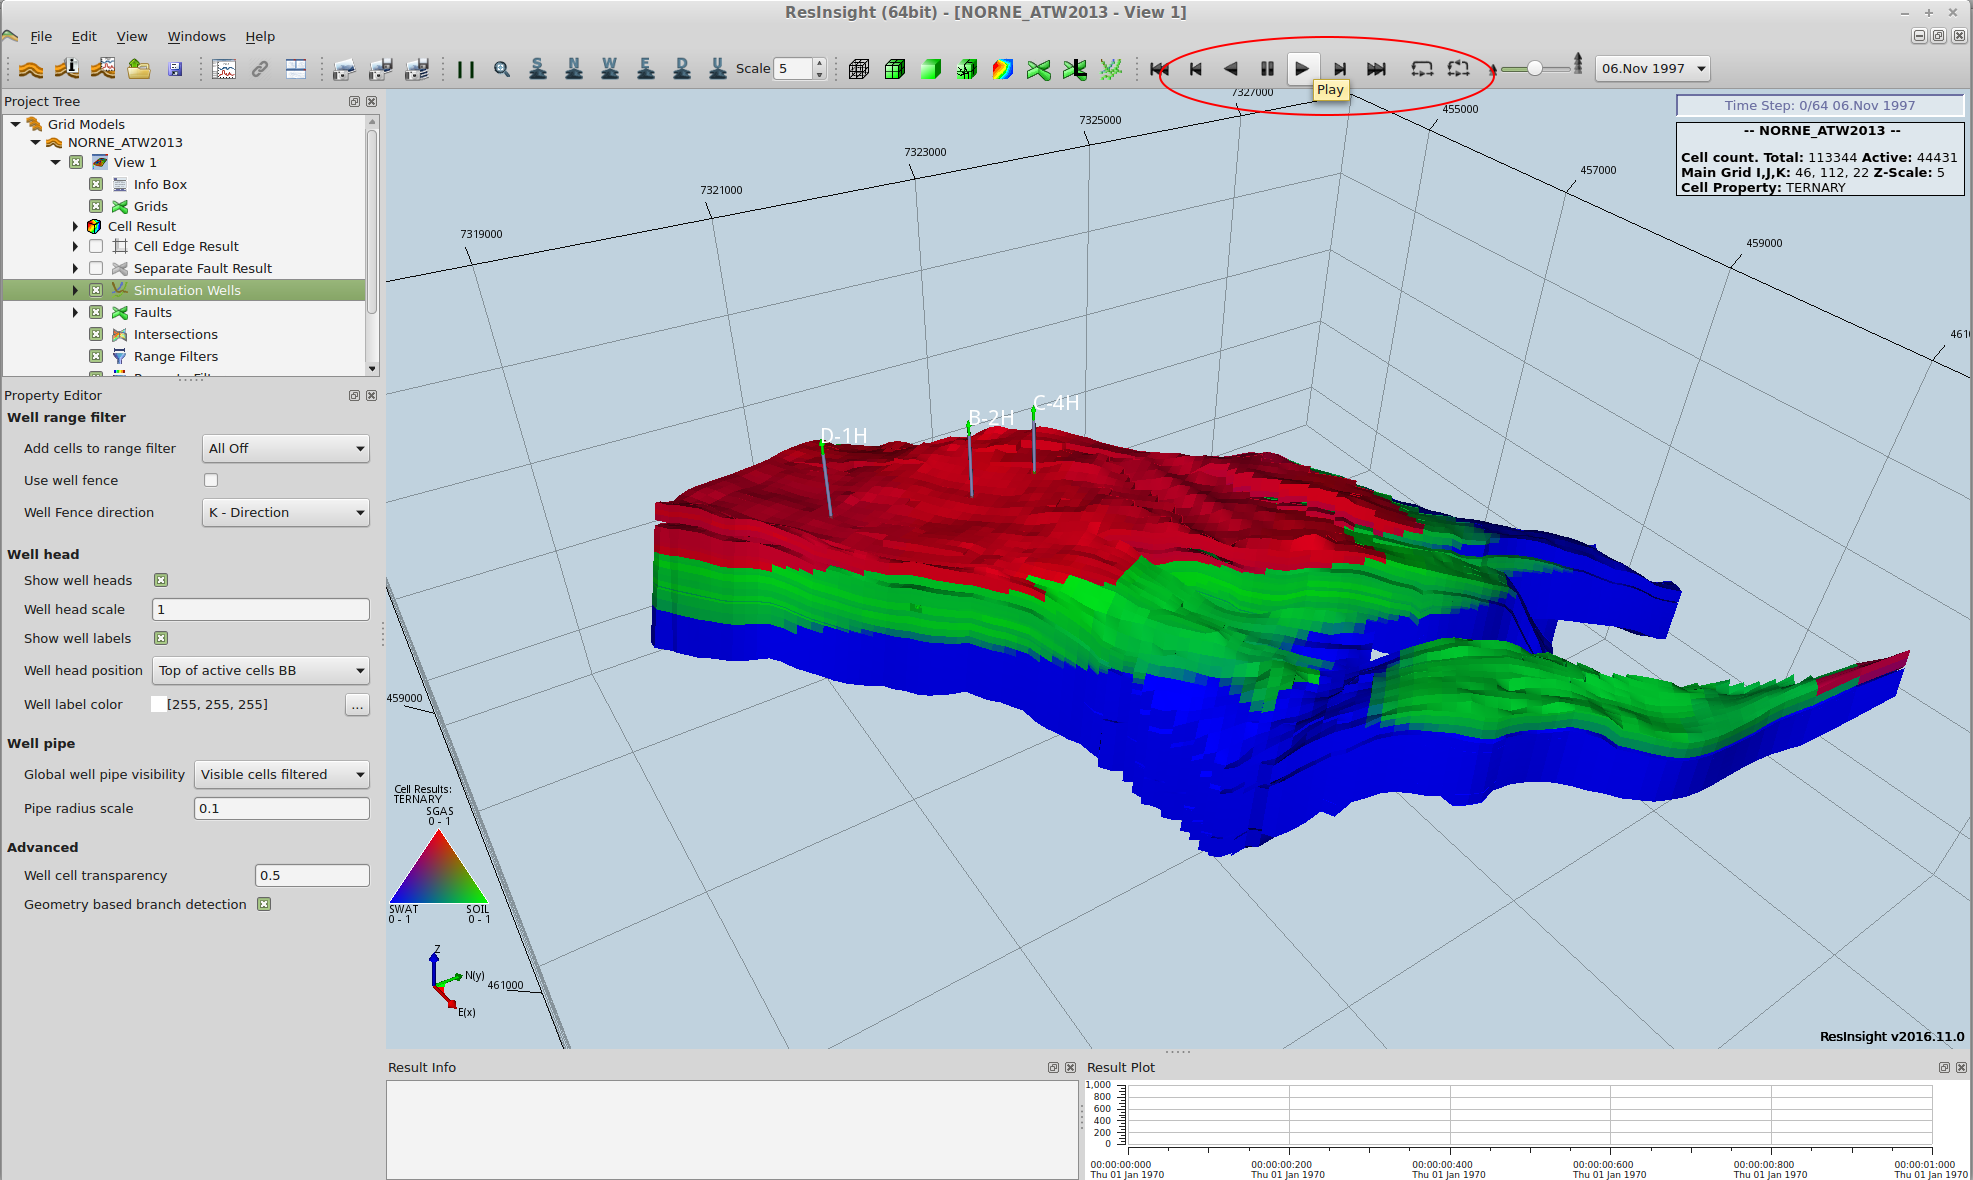
By clicking Pause you can stop at any timestep of your choosing. Note that the number of wells change during the simulation.