Plotting well curves
The results of the simulation can be viewed with several different tools, but we will here use the tool-chain that has the fewest dependencies.
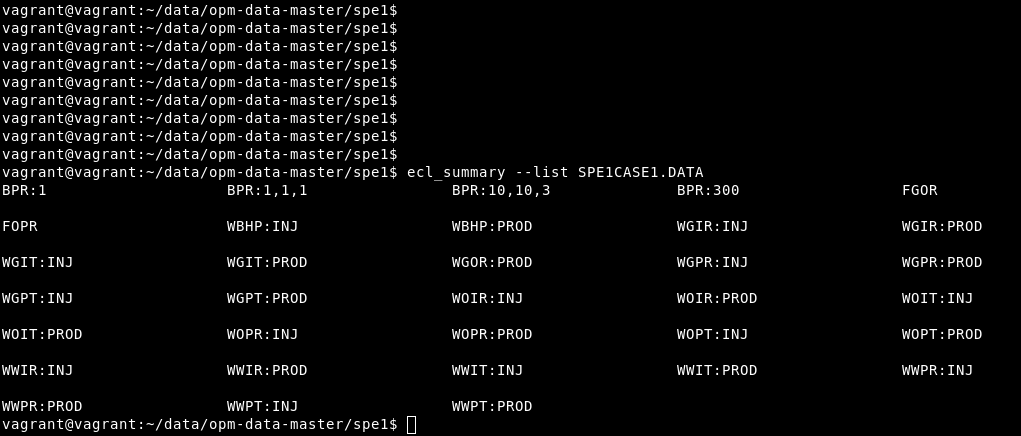
First, we will examine which variables we can view using the ecl_summary tool from libecl, which should already be installed since libecl is needed by Flow. (Note: if you installed libecl from source, the program is called summary.x and will be located in your build directory.) By typing
ecl_summary --list SPE1CASE1.DATA
we get a list of the different variables that are available:
Some of the more interesting ones are:
- WBHP:INJ – Bottom hole pressure of INJ well
- WGIR:INJ – Gas injection rate of INJ well
- WBHP:PROD – Bottom hole pressure of PROD well
- WOPR:PROD – Oil production rate of PROD well
- WGPR:PROD – Gas production rate of PROD well
To manually inspect the values you can also use the same tool, for example:
ecl_summary SPE1CASE1.DATA WBHP:INJ
