Next, we use a python script called summaryplot from opm-utilities to plot these variables. Start by downloading the script with the following commands:
wget https://raw.githubusercontent.com/OPM/opm-utilities/master/summaryplot
Summary plot requires python and the ECL python bindings:
sudo apt-get install python-ecl python-numpy python-matplotlib libecl-dev
Then, we can plot the well curves with the following command:
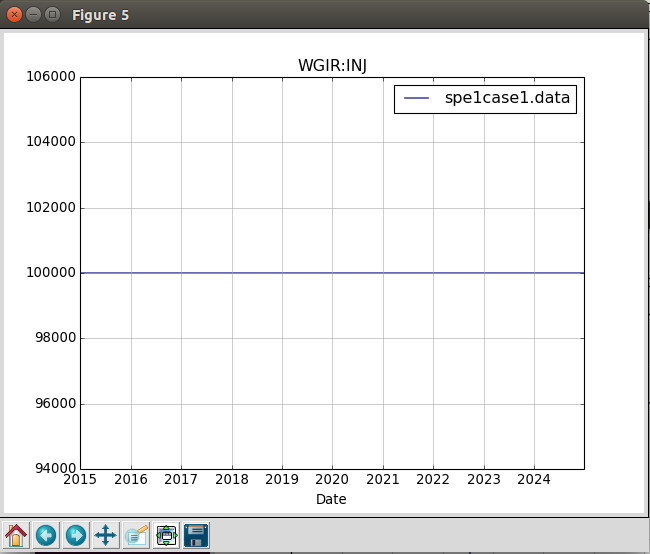
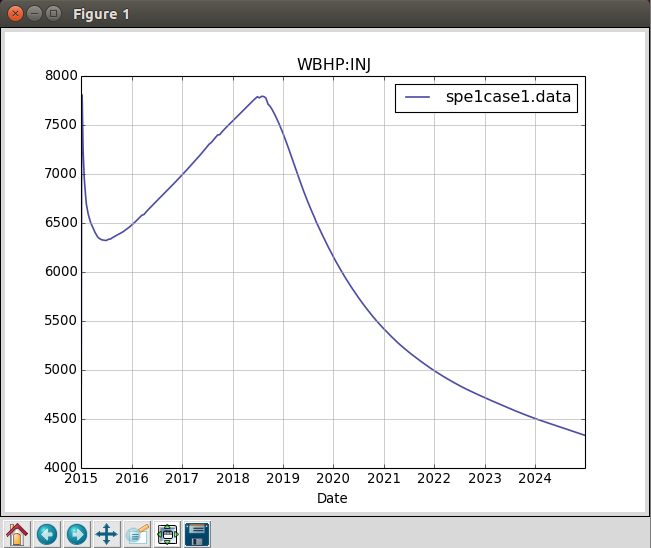
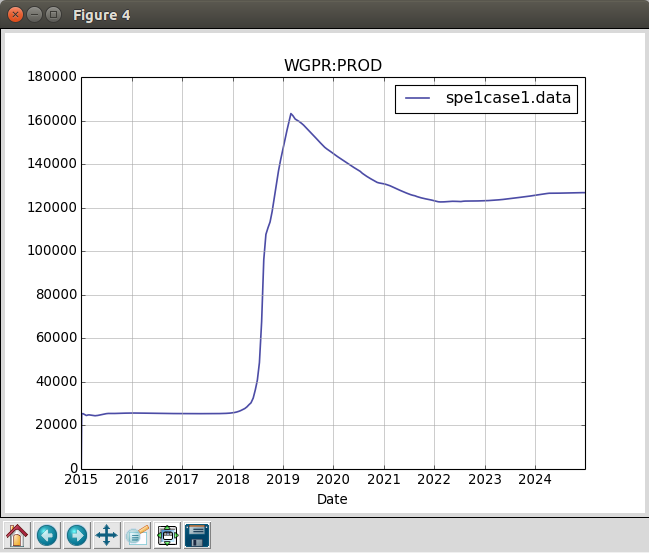
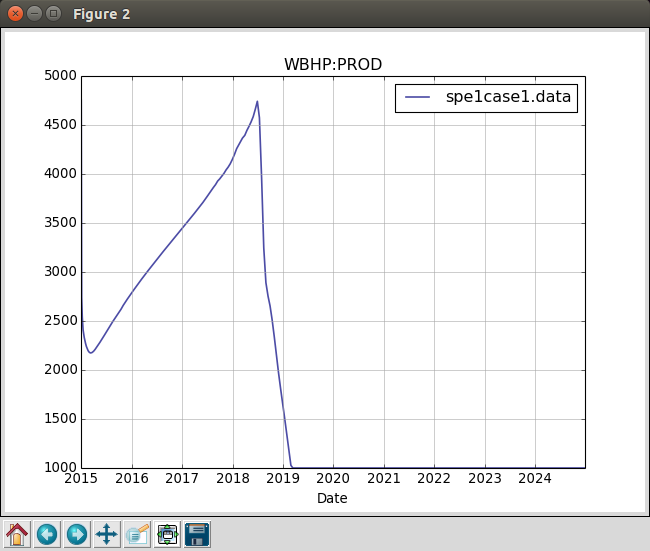
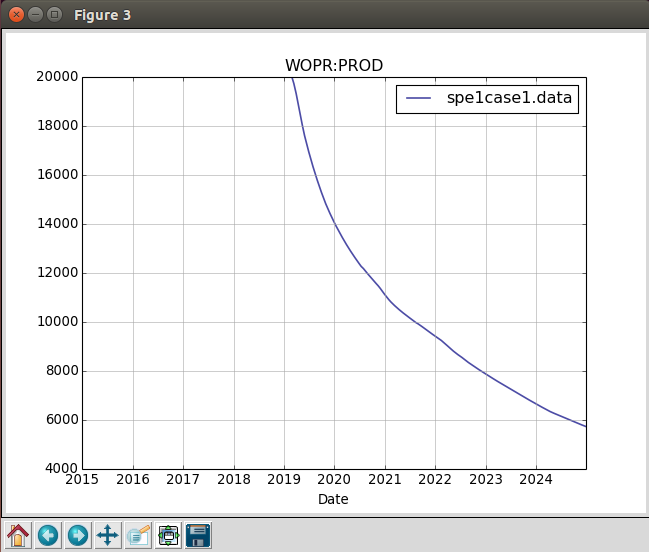
python summaryplot WBHP:INJ WBHP:PROD WOPR:PROD WGPR:PROD WGIR:INJ SPE1CASE1.DATA
The result can be seen in the figures below. It is worth noting that since the input deck specifies FIELD units (psi for pressure, etc.), the output produced by Flow will use that as well.